Fig. 13
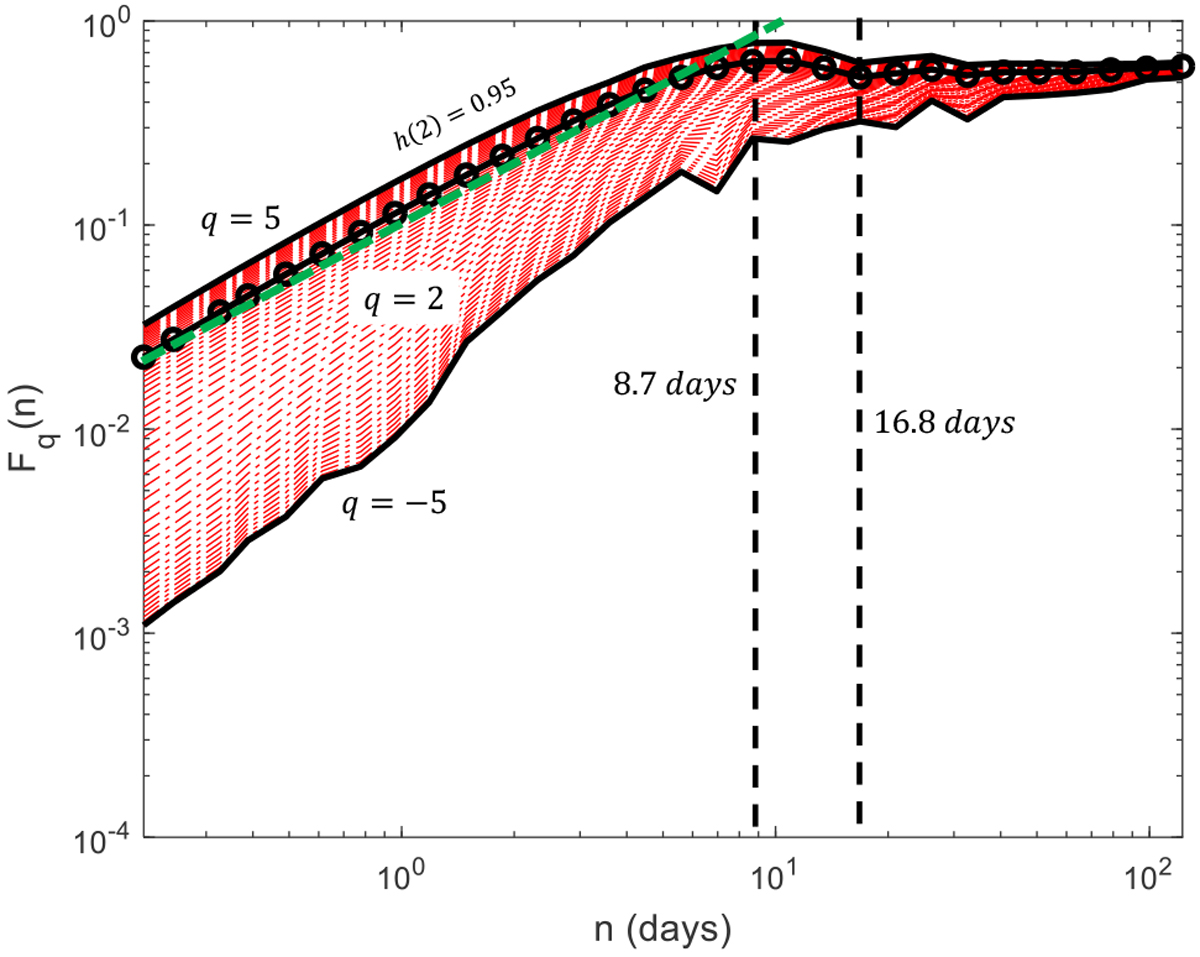
Log-log plot of the fluctuation functions Fq(n) (black circle for q = 2) calculated for the final PDC time series presented in Fig. 5. The red curves correspond to q between −5 and 5 in steps of 0.2. Vertical dashed lines mark three domains of the fitting windows for the small n between 29.4min and 8.7 days, for middle n between 8.7 and 16.8 days and, for the large n greater than 16.8 days. The green dashed line gives the average slope H = h(2) = 0.95 for timescales shorter than 8.7 days.
Current usage metrics show cumulative count of Article Views (full-text article views including HTML views, PDF and ePub downloads, according to the available data) and Abstracts Views on Vision4Press platform.
Data correspond to usage on the plateform after 2015. The current usage metrics is available 48-96 hours after online publication and is updated daily on week days.
Initial download of the metrics may take a while.