Free Access
Fig. 12
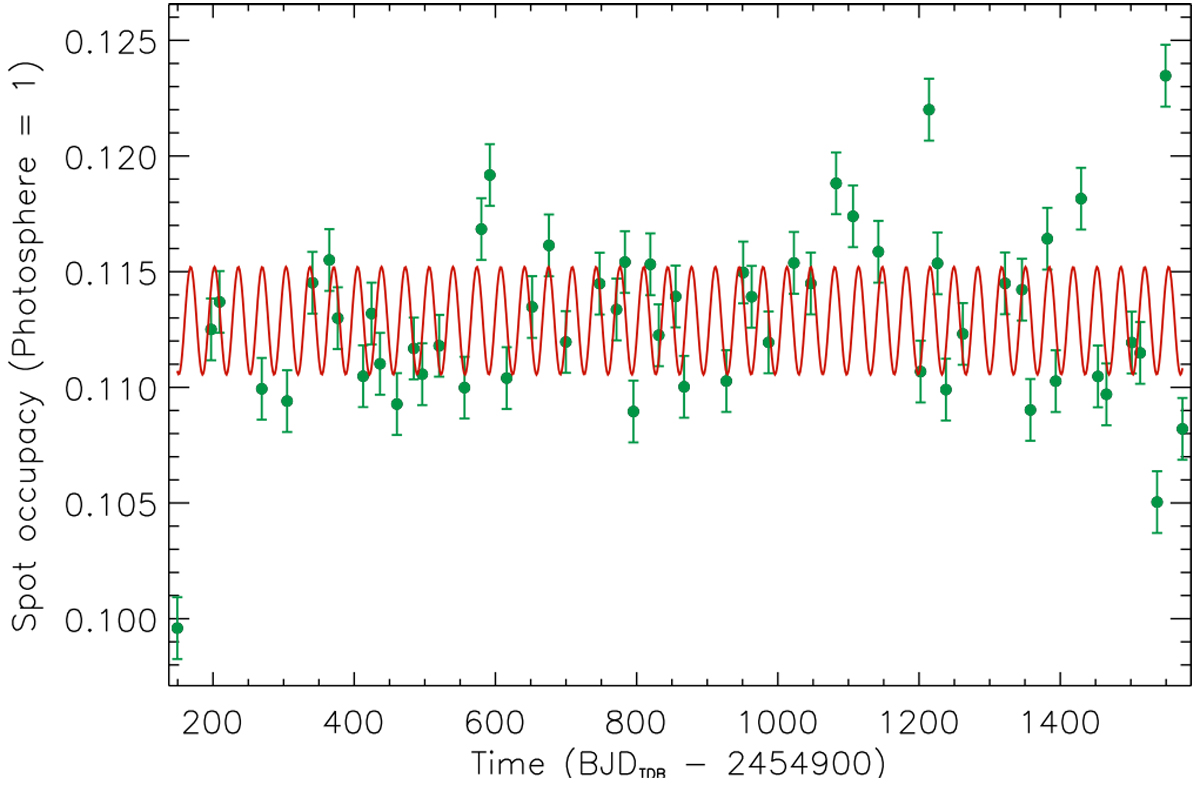
Total spotted area on Kepler-30 as derived from the spot modelling of the PDC light curve versus the time (green dots). A sinusoid with a period of 33.784 days corresponding to the maximum of the GLS periodogram is overplotted (red solid line).
Current usage metrics show cumulative count of Article Views (full-text article views including HTML views, PDF and ePub downloads, according to the available data) and Abstracts Views on Vision4Press platform.
Data correspond to usage on the plateform after 2015. The current usage metrics is available 48-96 hours after online publication and is updated daily on week days.
Initial download of the metrics may take a while.