Fig. 11
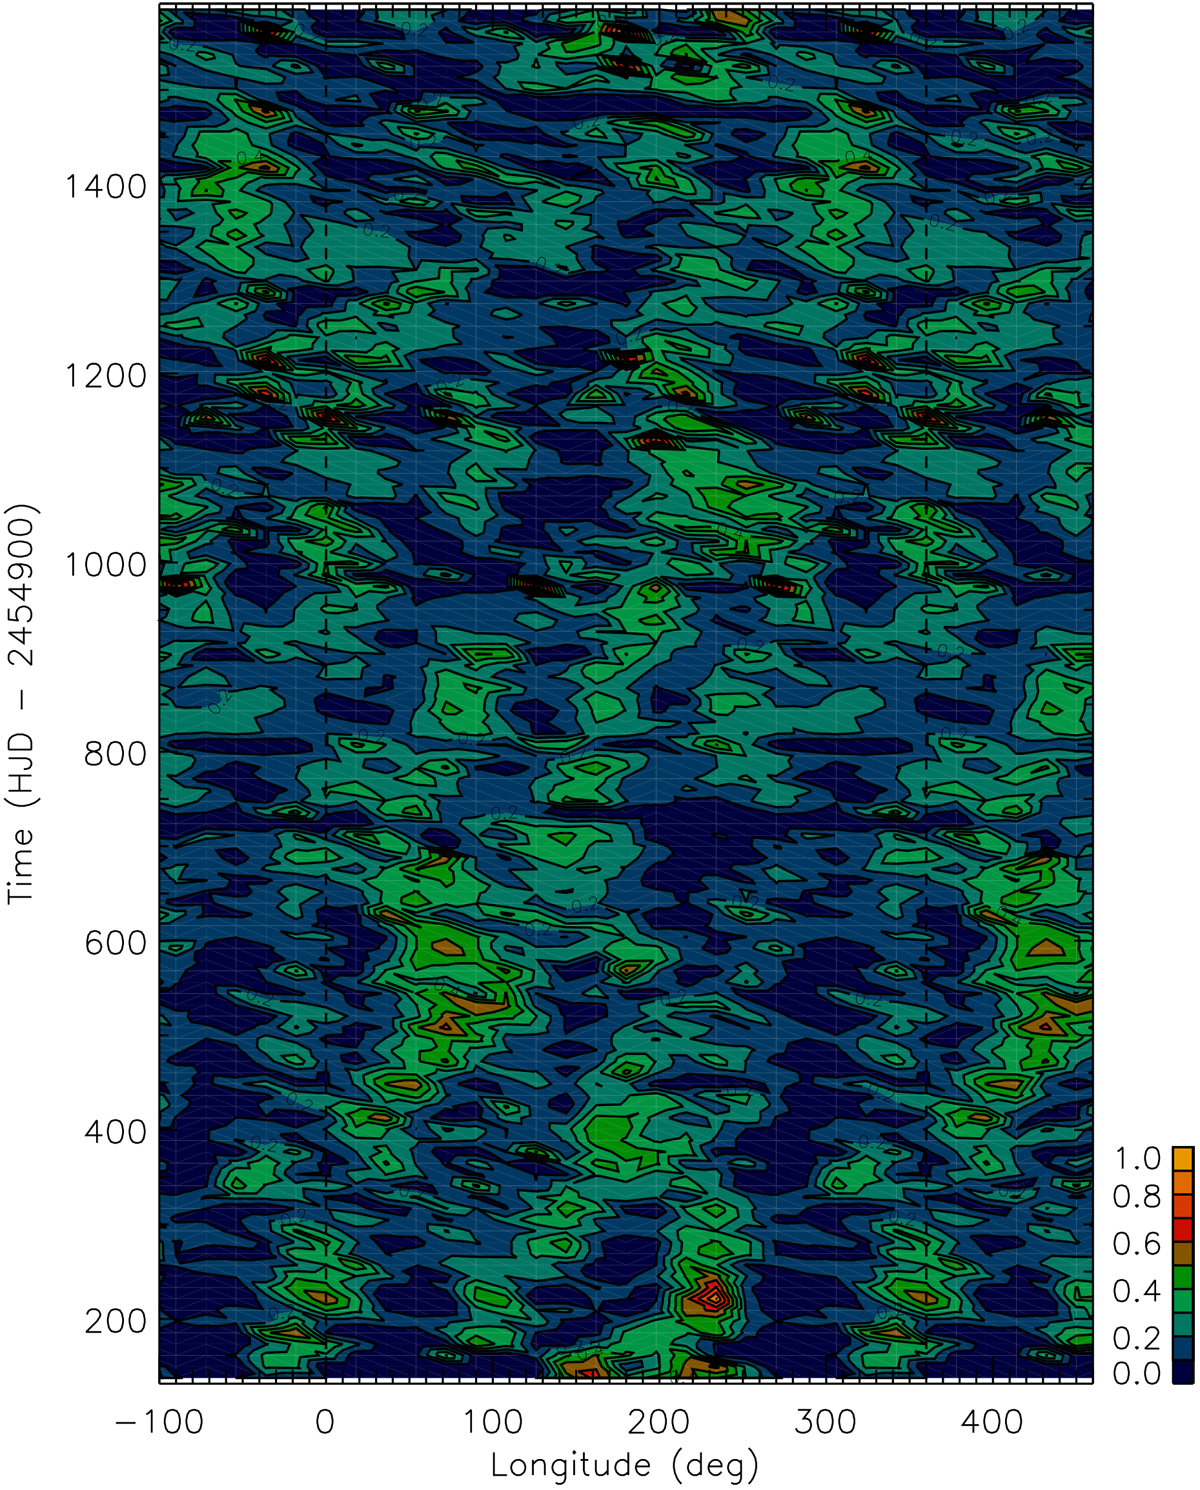
Distribution of the spot filling factor vs. the longitude and time for the ME regularised spot model of the PDC light curve of Kepler-30. The minimum of the filling factor corresponds to dark blue regions, while the maximum is rendered in orange (see the colour scale close to the lower right corner of the plot). We note that the longitude scale of the horizontal axis is extended beyond the [0°, 360°] interval to better follow the migration of the starspots.
Current usage metrics show cumulative count of Article Views (full-text article views including HTML views, PDF and ePub downloads, according to the available data) and Abstracts Views on Vision4Press platform.
Data correspond to usage on the plateform after 2015. The current usage metrics is available 48-96 hours after online publication and is updated daily on week days.
Initial download of the metrics may take a while.