Fig. 9.
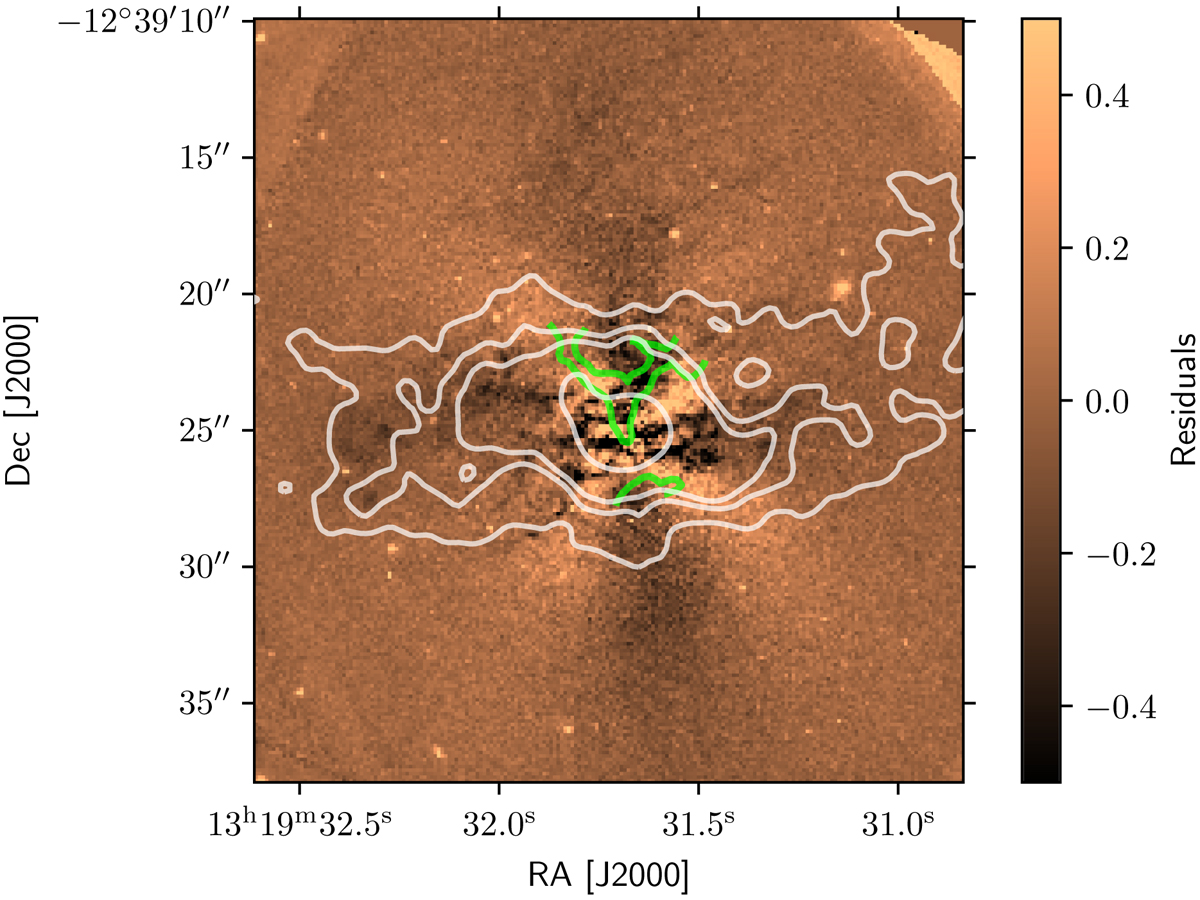
Ellipse fitting residuals showing the filamentary dust on the HST WFPC2 F702W band image. The residuals with dark colours highlight regions of obscuration by dust. The white contours show the distribution of ionised gas, and the green contours represent the gas velocity dispersion levels of σ = 200 km s−1 and σ = 250 km s−1 to show the direction of the AGN-driven outflow. The dust follows the flux distribution of ionised gas in the east-west direction. The dust is located in the same north-south direction as the outflow.
Current usage metrics show cumulative count of Article Views (full-text article views including HTML views, PDF and ePub downloads, according to the available data) and Abstracts Views on Vision4Press platform.
Data correspond to usage on the plateform after 2015. The current usage metrics is available 48-96 hours after online publication and is updated daily on week days.
Initial download of the metrics may take a while.