Fig. 3.
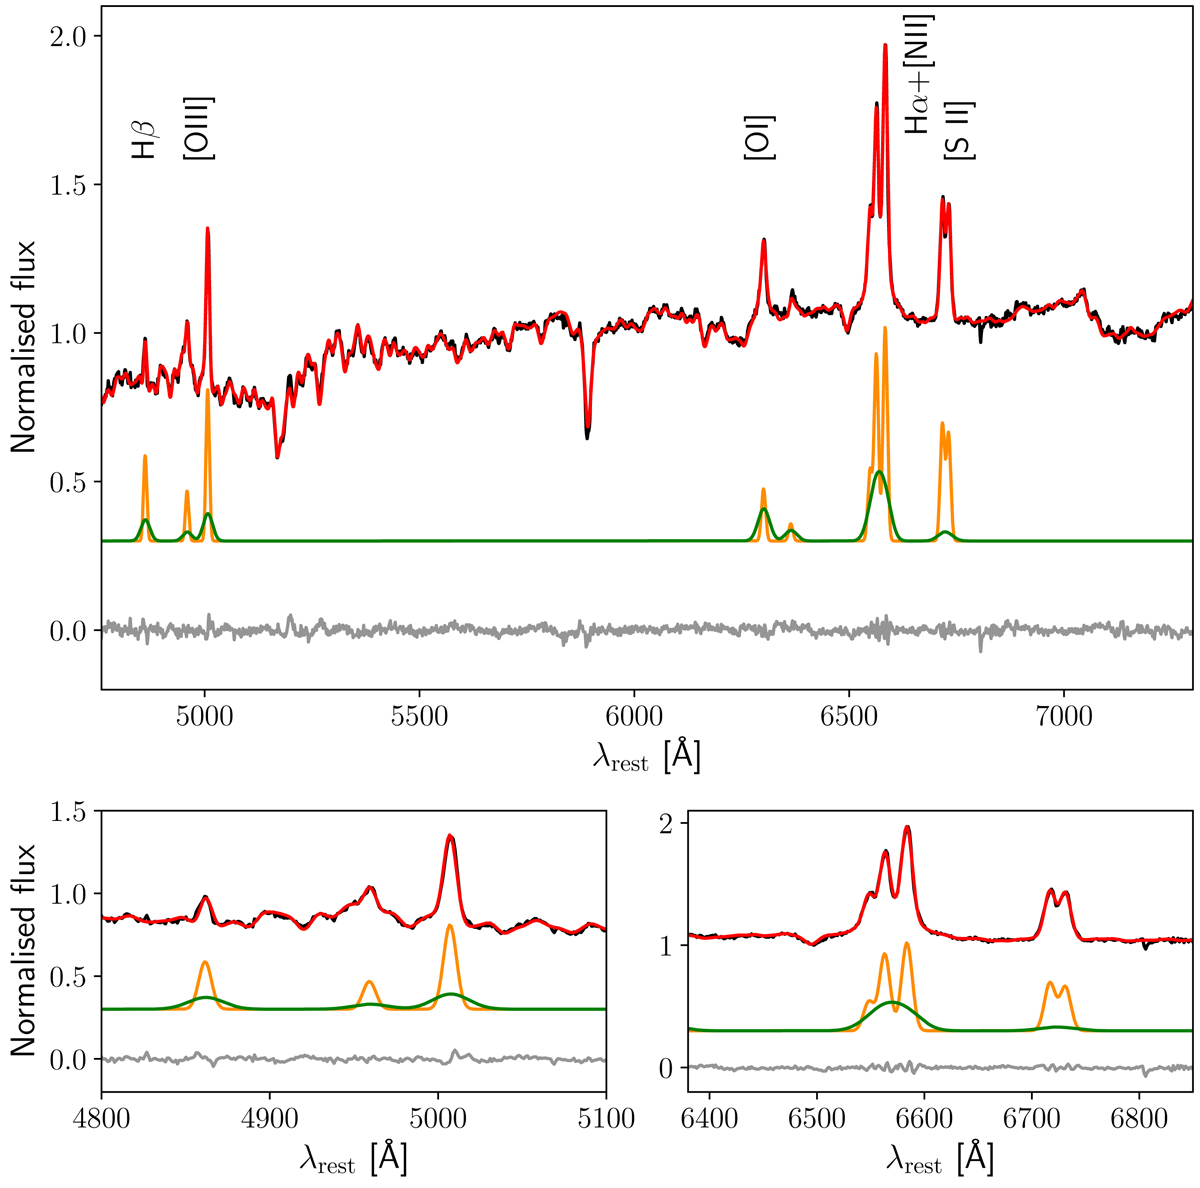
Nuclear spectrum of NGC 5077 extracted from an integrated region of 1 × 1 arcsec2 (solid black line). The region is centred at the position of the AGN as given by the peak of the Hα integrated emission. The best-fit model is shown in red. The two emission line components (green and orange) are shown in the middle of the panels, with a vertical offset for illustrative purposes. The residuals from the fit are shown in grey at the bottom of each panel. Top panel: wide wavelength range, while the two bottom panels show a zoom-in of the spectral region of the Hβ and [O III] emission lines (left) and the Hα, [N II], and [S II] emission lines (right). The emission lines are well represented by the presence of two kinematic components, one with a velocity dispersion of ∼210 km s−1 and the other with ∼640 km s−1.
Current usage metrics show cumulative count of Article Views (full-text article views including HTML views, PDF and ePub downloads, according to the available data) and Abstracts Views on Vision4Press platform.
Data correspond to usage on the plateform after 2015. The current usage metrics is available 48-96 hours after online publication and is updated daily on week days.
Initial download of the metrics may take a while.