Fig. 10.
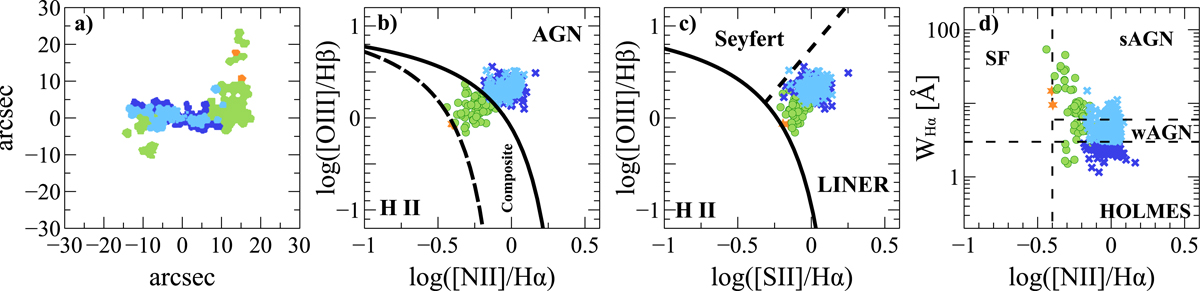
BPT spatially resolved diagrams for the regions of NGC 5077 where ionised gas (Hβ, [O III], Hα, [N II], and [S II]) is significantly detected. Left panel: colour-coded regions to facilitate the identification of spatial trends. Panels b and c: each show a different line ratio diagnostic, and panel d shows the Hα equivalent width as a function of [N II]/Hα (‘WHAN’) diagram. The labels and the solid or dashed lines indicate the plausible excitation mechanisms in each region of the diagram (see the text for a description). The coloured symbols match the line ratios measured for the corresponding colour-coded regions of the left panel. The diagrams show that there is a dominant contribution of AGN excitation in most of the regions (green circles and light blue crosses). The dark blue crosses show regions where post-AGB stars make an equal or larger contribution than the AGN to the ionising field.
Current usage metrics show cumulative count of Article Views (full-text article views including HTML views, PDF and ePub downloads, according to the available data) and Abstracts Views on Vision4Press platform.
Data correspond to usage on the plateform after 2015. The current usage metrics is available 48-96 hours after online publication and is updated daily on week days.
Initial download of the metrics may take a while.