Fig. 1.
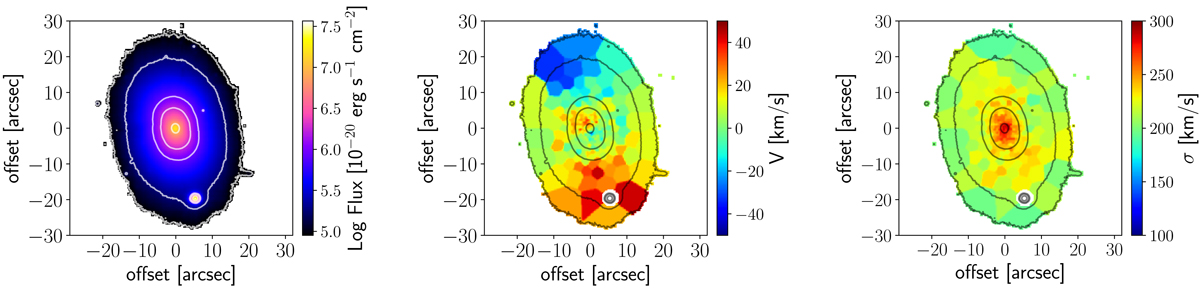
Two-dimensional maps of integrated light, stellar velocity, and stellar velocity dispersion. Left panel: map of integrated light within the MUSE spectral range. The isophotes are shown as contours of 50%, 10%, 5%, 1%, and 0.5% of the peak flux value. Regions with lower flux were masked out of the image. Middle panel: line of sight stellar velocity. Right panel: stellar velocity dispersion. North is up, east is left, the origin is defined as the position of the AGN, and 10 arcsec corresponds to 2.2 kpc. The point source south of the nucleus is a foreground star that was masked out in the centre and right panels.
Current usage metrics show cumulative count of Article Views (full-text article views including HTML views, PDF and ePub downloads, according to the available data) and Abstracts Views on Vision4Press platform.
Data correspond to usage on the plateform after 2015. The current usage metrics is available 48-96 hours after online publication and is updated daily on week days.
Initial download of the metrics may take a while.