Fig. 5.
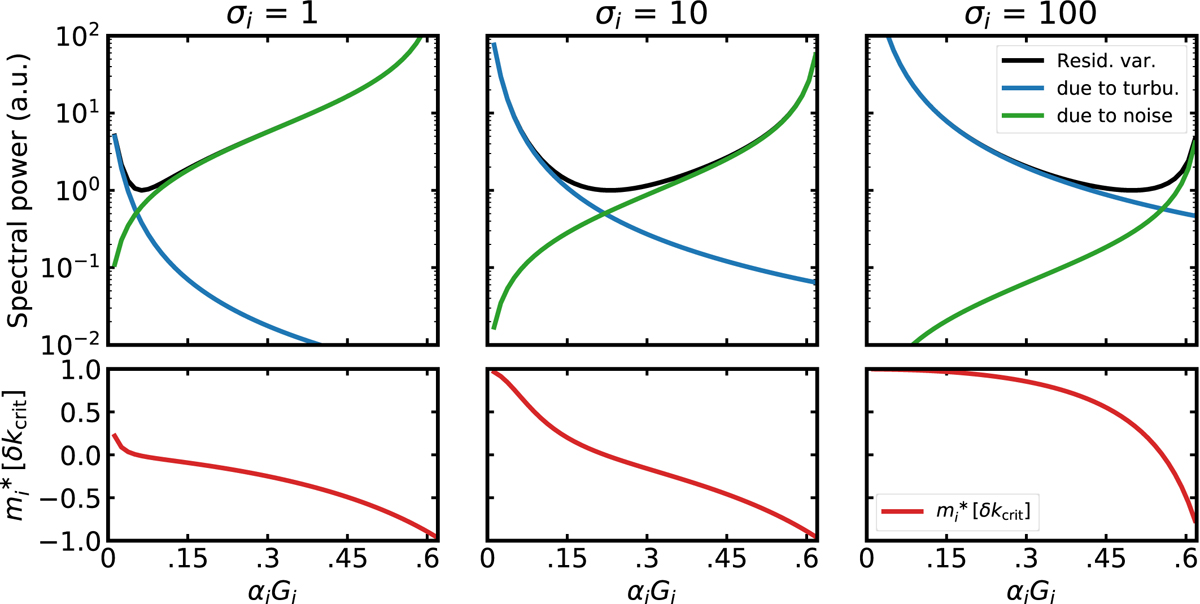
For effective S/N σi = 1, 10, and 100, closed-loop residual variances (top panels) and resulting δkcrit autocorrelation of the measurements (bottom panels) as a function of the loop gain αiGi from 0 up to gcrit. The latency is taken as τ = 2.T. Black lines show the total residual variance ![]() normalized to 1 at its minimum, blue represents the variance induced by turbulence
normalized to 1 at its minimum, blue represents the variance induced by turbulence ![]() , and green shows the variance induced by noise
, and green shows the variance induced by noise ![]() .
.
Current usage metrics show cumulative count of Article Views (full-text article views including HTML views, PDF and ePub downloads, according to the available data) and Abstracts Views on Vision4Press platform.
Data correspond to usage on the plateform after 2015. The current usage metrics is available 48-96 hours after online publication and is updated daily on week days.
Initial download of the metrics may take a while.