Fig. 10.
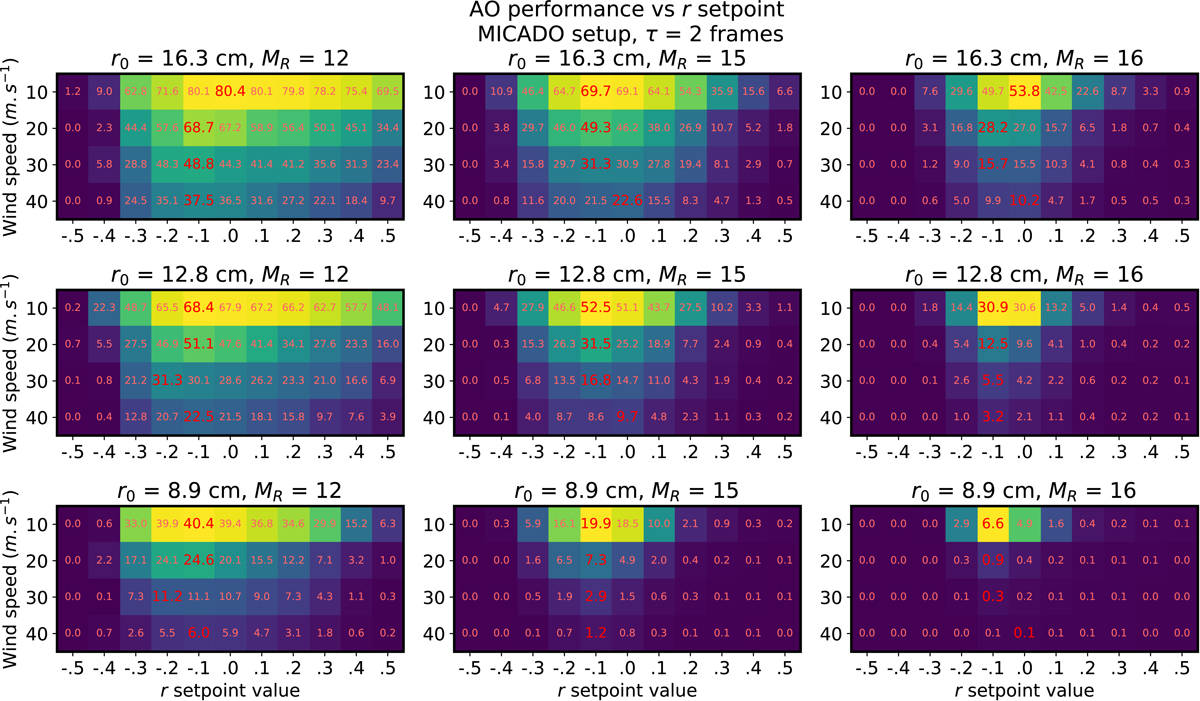
Long-exposure SR in H band (color and text) for stationary simulations exploring different conditions regarding the seeing (outer rows), the guide-star magnitude (outer columns), the wind speed (inner rows), and the CLOSE setpoint (inner columns) for the MICADO SCAO simulation. Color scales are local to each of the subplots and do not match each other.
Current usage metrics show cumulative count of Article Views (full-text article views including HTML views, PDF and ePub downloads, according to the available data) and Abstracts Views on Vision4Press platform.
Data correspond to usage on the plateform after 2015. The current usage metrics is available 48-96 hours after online publication and is updated daily on week days.
Initial download of the metrics may take a while.