Fig. 6.
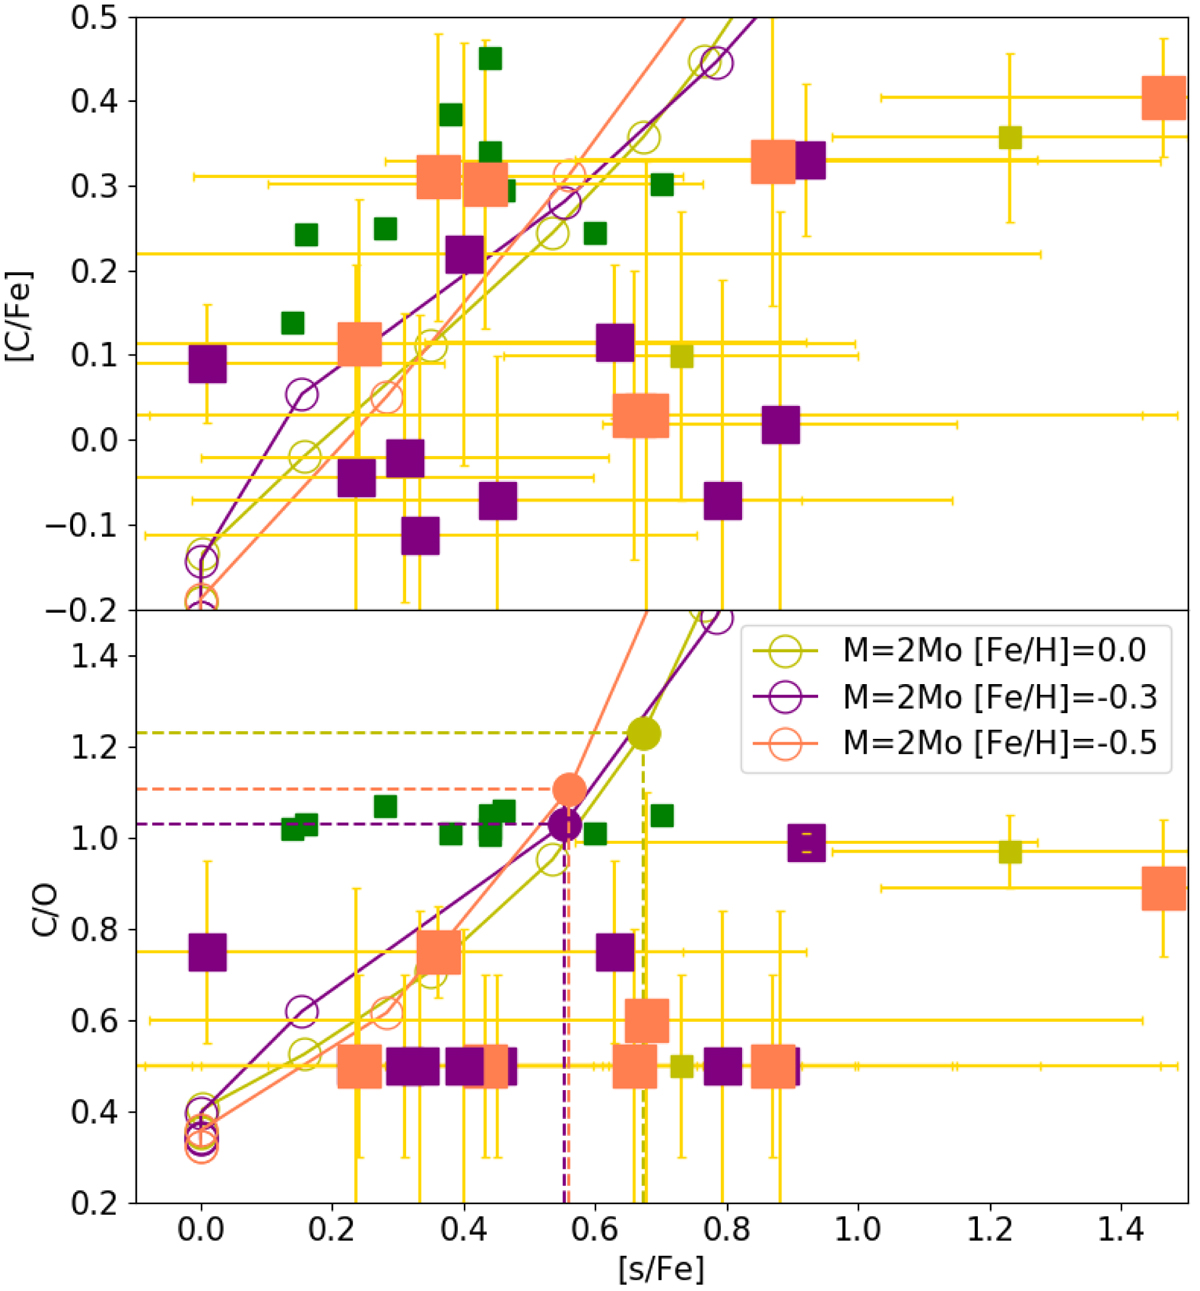
Distribution of the carbon abundance of our sample stars with respect to their [s/Fe] index. Top panel: measured [C/Fe] abundances as a function of [s/Fe] for our large sample of Tc-rich S stars (light green, purple and orange squares) where the size of the symbol increases with decreasing metallicity, considering three metallicity bins: [Fe/H] in [0.0; −0.2]: light green, [−0.2; −0.4]: purple, below −0.4: orange. Tc-rich carbon stars from Abia et al. (2002) are shown as green squares. Bottom panel: derived C/O ratio versus [s/Fe] for the same stars. Predictions for a 2 M⊙ STAREVOL model at metallicity [Fe/H] = 0.0 (light green), −0.3 (violet) and −0.5 (orange) are overplotted. The empty circles along the tracks indicate the successive TDUs, while the three filled circles mark the first TDU, which led to C/O > 1 in each model.
Current usage metrics show cumulative count of Article Views (full-text article views including HTML views, PDF and ePub downloads, according to the available data) and Abstracts Views on Vision4Press platform.
Data correspond to usage on the plateform after 2015. The current usage metrics is available 48-96 hours after online publication and is updated daily on week days.
Initial download of the metrics may take a while.