Fig. 5.
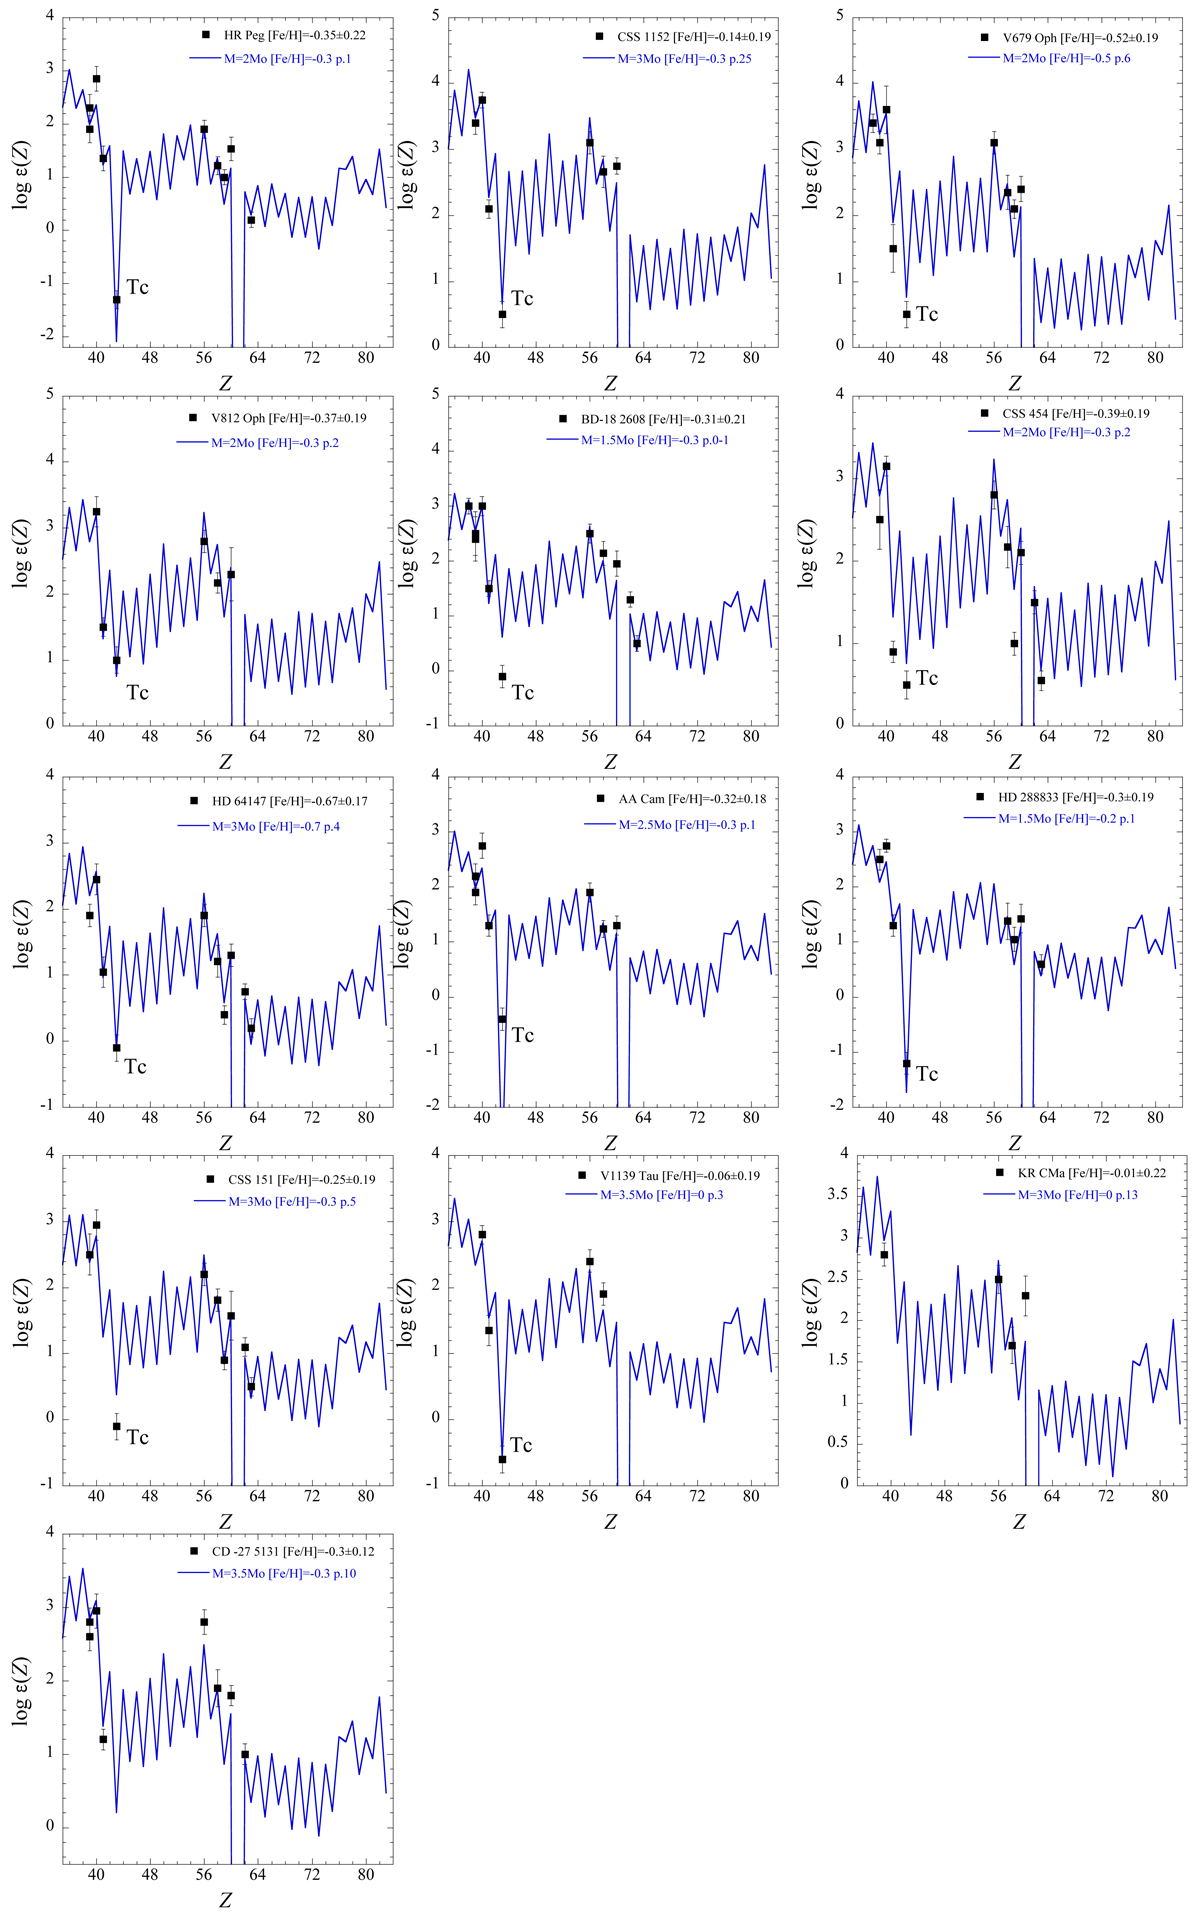
Measured s-process element abundances compared with the nucleosynthesis predictions. The blue line represents the nucleosynthesis predictions compatible with the mass and metallicity of the individual stars. The number of pulses n required to best-match the measured abundances is mentioned in the label of every panel as “p.n”.
Current usage metrics show cumulative count of Article Views (full-text article views including HTML views, PDF and ePub downloads, according to the available data) and Abstracts Views on Vision4Press platform.
Data correspond to usage on the plateform after 2015. The current usage metrics is available 48-96 hours after online publication and is updated daily on week days.
Initial download of the metrics may take a while.