Fig. 1.
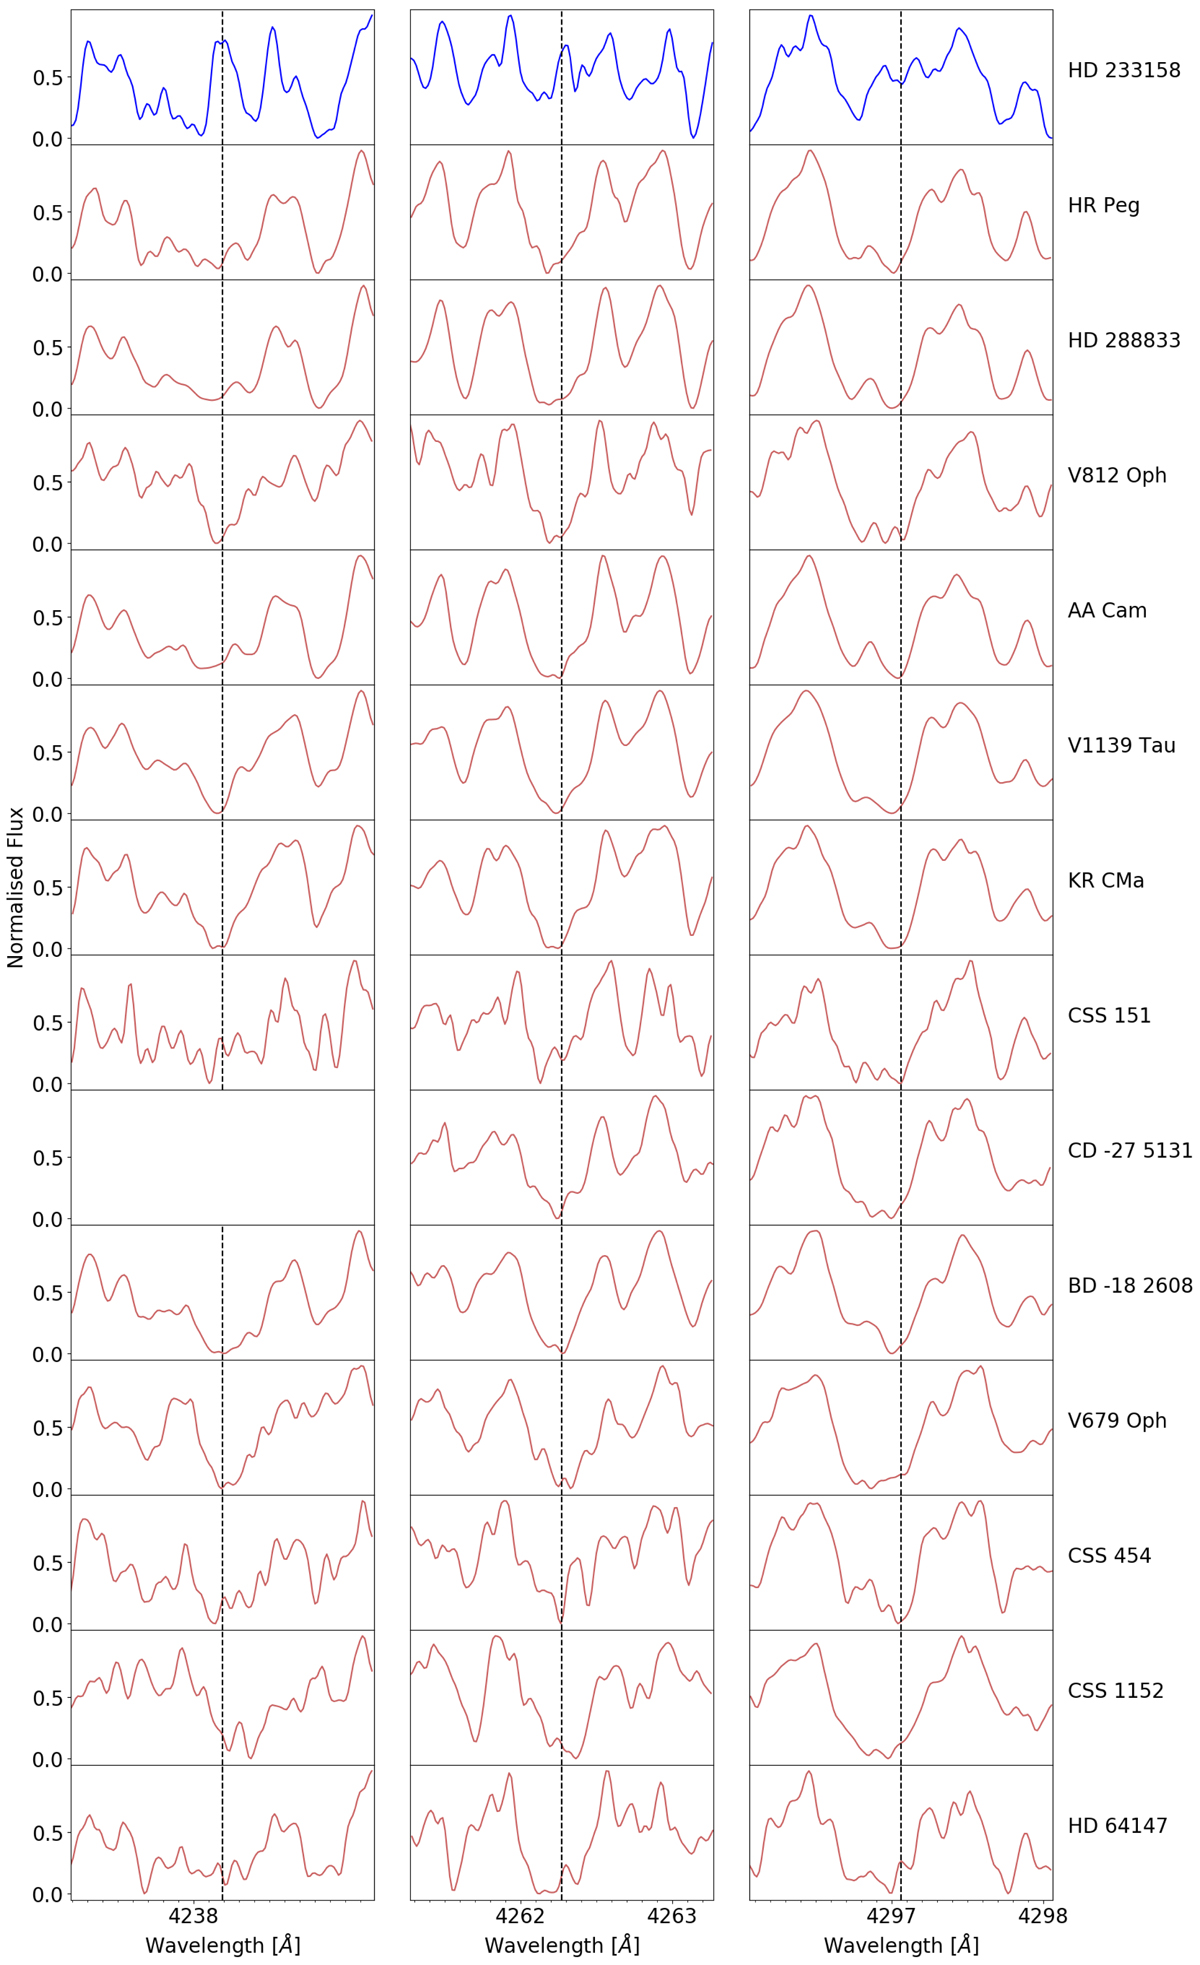
Spectral region around the three (4238.19, 4262.27 and 4297.06 Å) Tc I lines in our sample of Tc-rich S stars. For comparison purposes, the spectrum of a Tc-poor S star (HD 233158, in blue in the top panels) from S18 is also plotted. The spectra have been arbitrarily normalized and binned by a factor of 1.5 to increase the S/N. The Tc I line at 4238.19 Å could not be used for CD −27°5131 as local normalization was hampered by a nearby cosmic ray hit.
Current usage metrics show cumulative count of Article Views (full-text article views including HTML views, PDF and ePub downloads, according to the available data) and Abstracts Views on Vision4Press platform.
Data correspond to usage on the plateform after 2015. The current usage metrics is available 48-96 hours after online publication and is updated daily on week days.
Initial download of the metrics may take a while.