Fig. 3
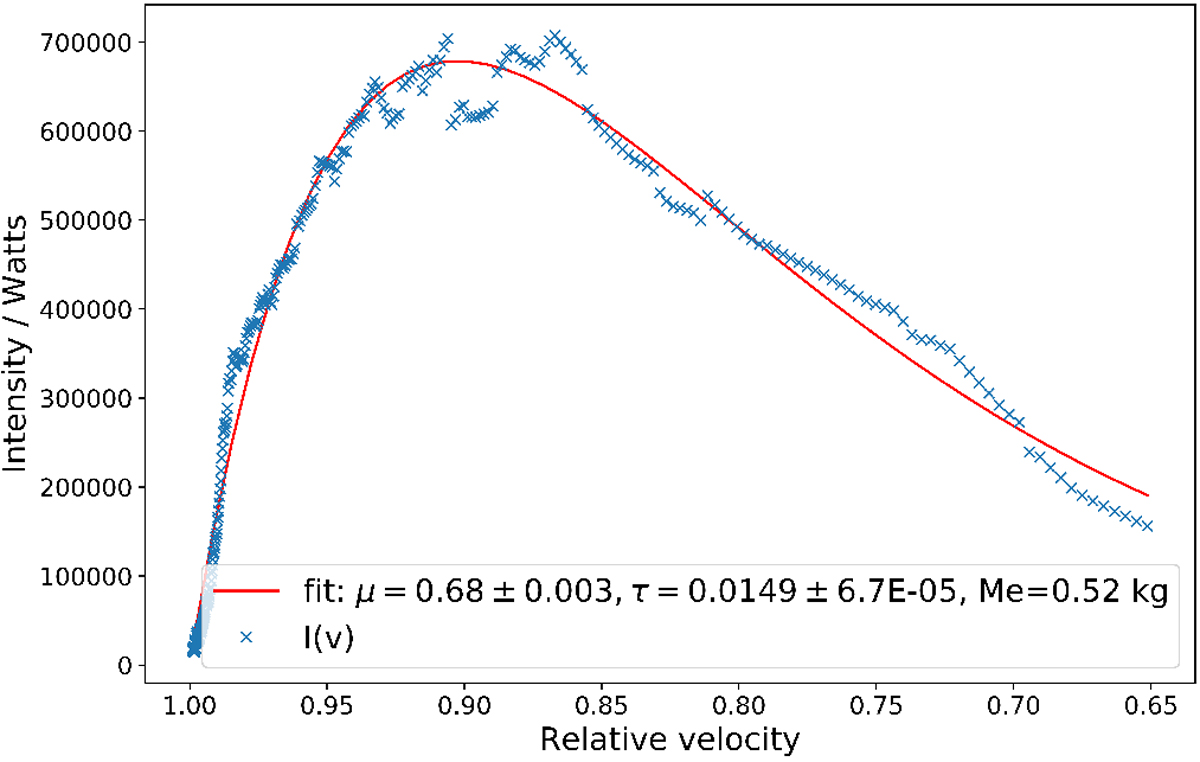
Computed light curve of the fireball from 19 May 2018 with applied fit. The x-axis displays the relative velocity v* of the fireball for which each velocity value is divided by the fireball’s initial velocity. The brightness values, calculated as explained in Sect. 4.3 for each point in time for which a median magnitude value could be determined, are shown as a blue ‘×’. The applied fit is displayed as a solid red line.
Current usage metrics show cumulative count of Article Views (full-text article views including HTML views, PDF and ePub downloads, according to the available data) and Abstracts Views on Vision4Press platform.
Data correspond to usage on the plateform after 2015. The current usage metrics is available 48-96 hours after online publication and is updated daily on week days.
Initial download of the metrics may take a while.