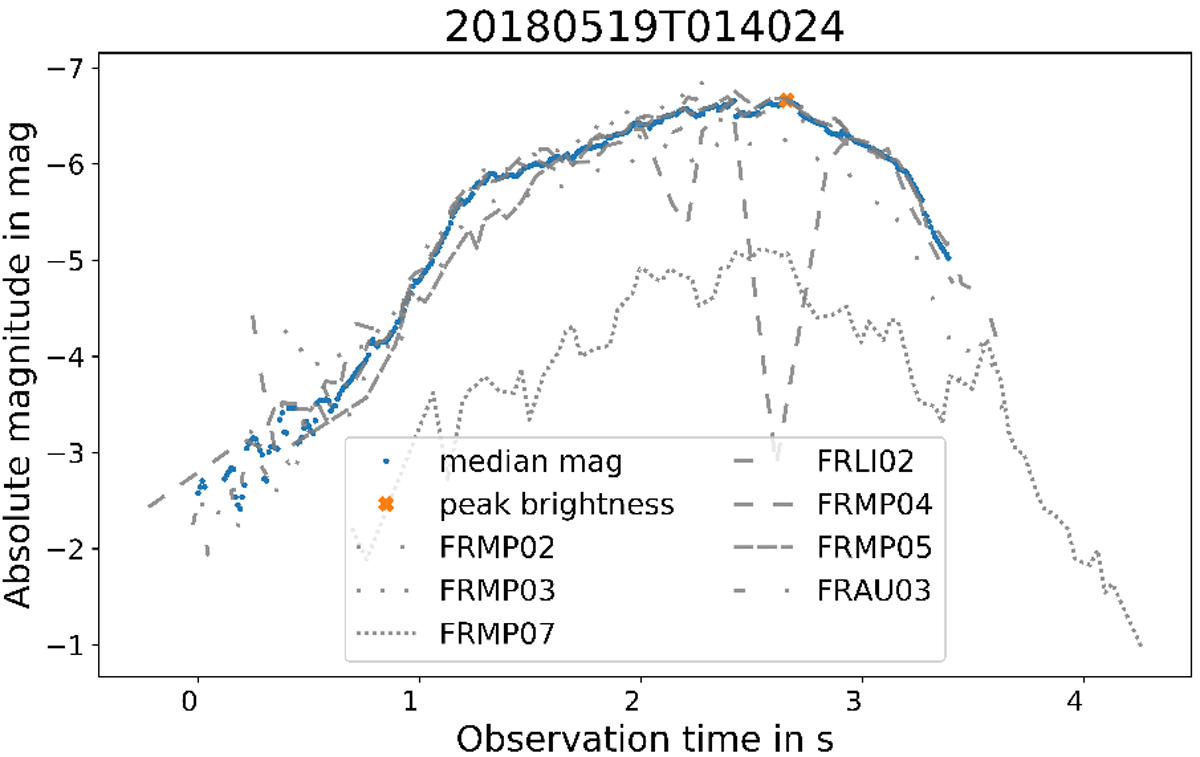
Fig. 2

Interpolated absolute magnitude data from seven single stations for the fireball from 19 May 2018 presented as linestyle-coded lines. The x-axis displays the time of observation of the fireball (in seconds), starting with the time of the first absolute magnitude value from the stations considered (first value of the computed median magnitudes), which correlates with 01:40:25 UT. The median absolute magnitudes, calculated for each point in time the fireball was visible,are shown as blue dots. The maximum brightness of this median curve is highlighted with an orange ‘×’ and is −6.7 mag.
Current usage metrics show cumulative count of Article Views (full-text article views including HTML views, PDF and ePub downloads, according to the available data) and Abstracts Views on Vision4Press platform.
Data correspond to usage on the plateform after 2015. The current usage metrics is available 48-96 hours after online publication and is updated daily on week days.
Initial download of the metrics may take a while.


