Fig. 10
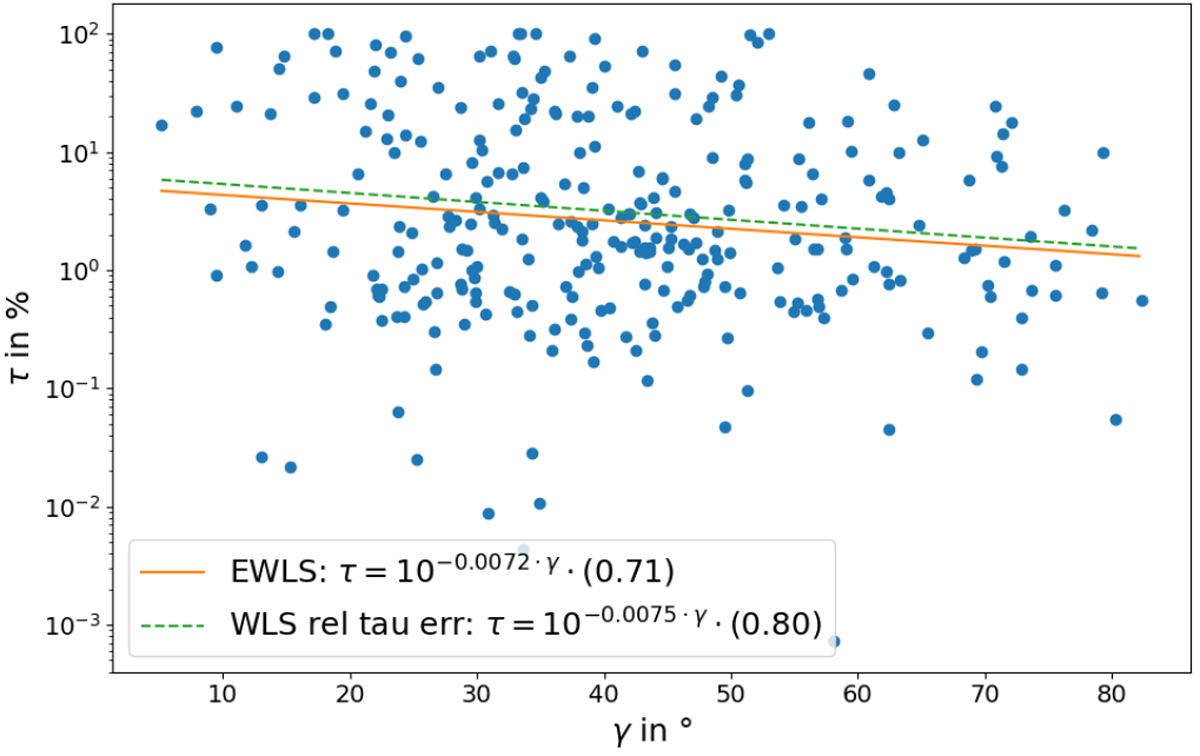
Luminous efficiencies as derived in this work plotted over the event’s entry angle γ with a fit through the data in semi-log space. Blue dots: values of τ. Orange line:equal-weighted least-squares fit (EWLS) applied to the data. Green dashed line: weighted least-squares fit (WLS) applied to the data; the method weights the values by the relative error of the value.
Current usage metrics show cumulative count of Article Views (full-text article views including HTML views, PDF and ePub downloads, according to the available data) and Abstracts Views on Vision4Press platform.
Data correspond to usage on the plateform after 2015. The current usage metrics is available 48-96 hours after online publication and is updated daily on week days.
Initial download of the metrics may take a while.