Fig. 9.
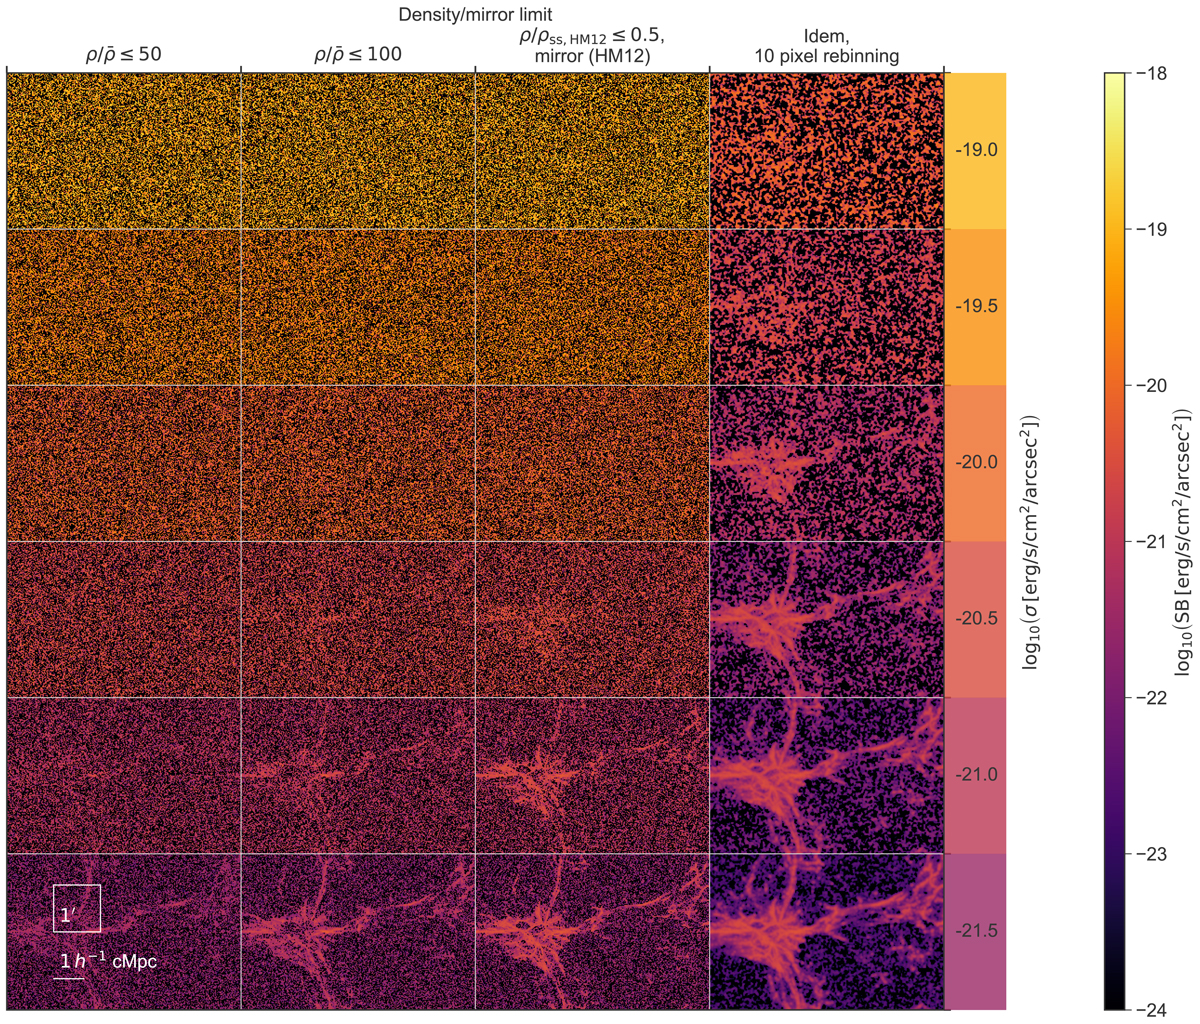
Repeated view of region 2 of the z = 4.8 SB map in Fig. 4 for different noise levels and assumptions on various limits. The SB map has a narrowband with Δλobs = 3.75 Å (∼1.19 h−1 cMpc) and is convolved with a Gaussian kernel with a FWHM of 0.75 arcsec before adding noise (as in the HDFS observation, see Bacon et al. 2015). The spatial extent of each panel is 5 × 3.3 arcmin2, or 7.8 × 5.2 h−2 cMpc2. The 1σ levels of the Gaussian noise applied per pixel (before rebinning) to each panel in the entire row are indicated directly to the right of the mosaic, coloured according to the colour bar on the very right, while the density cut-off and mirror limit (if applied) for each column is shown above the mosaic (see text for details). The final column is identical to the column next to it, but has a smoothing of 10 × 10 pixels or 2 × 2 arcsec2 applied (see text). Scales of 1 × 1 arcmin2 (the MUSE FOV) and 1 h−1 cMpc are indicated on the bottom left. Each panel in the image has 1500 × 1000 pixels, again making the pixel size equal to that of MUSE (0.2 arcsec per pixel).
Current usage metrics show cumulative count of Article Views (full-text article views including HTML views, PDF and ePub downloads, according to the available data) and Abstracts Views on Vision4Press platform.
Data correspond to usage on the plateform after 2015. The current usage metrics is available 48-96 hours after online publication and is updated daily on week days.
Initial download of the metrics may take a while.