Fig. 8.
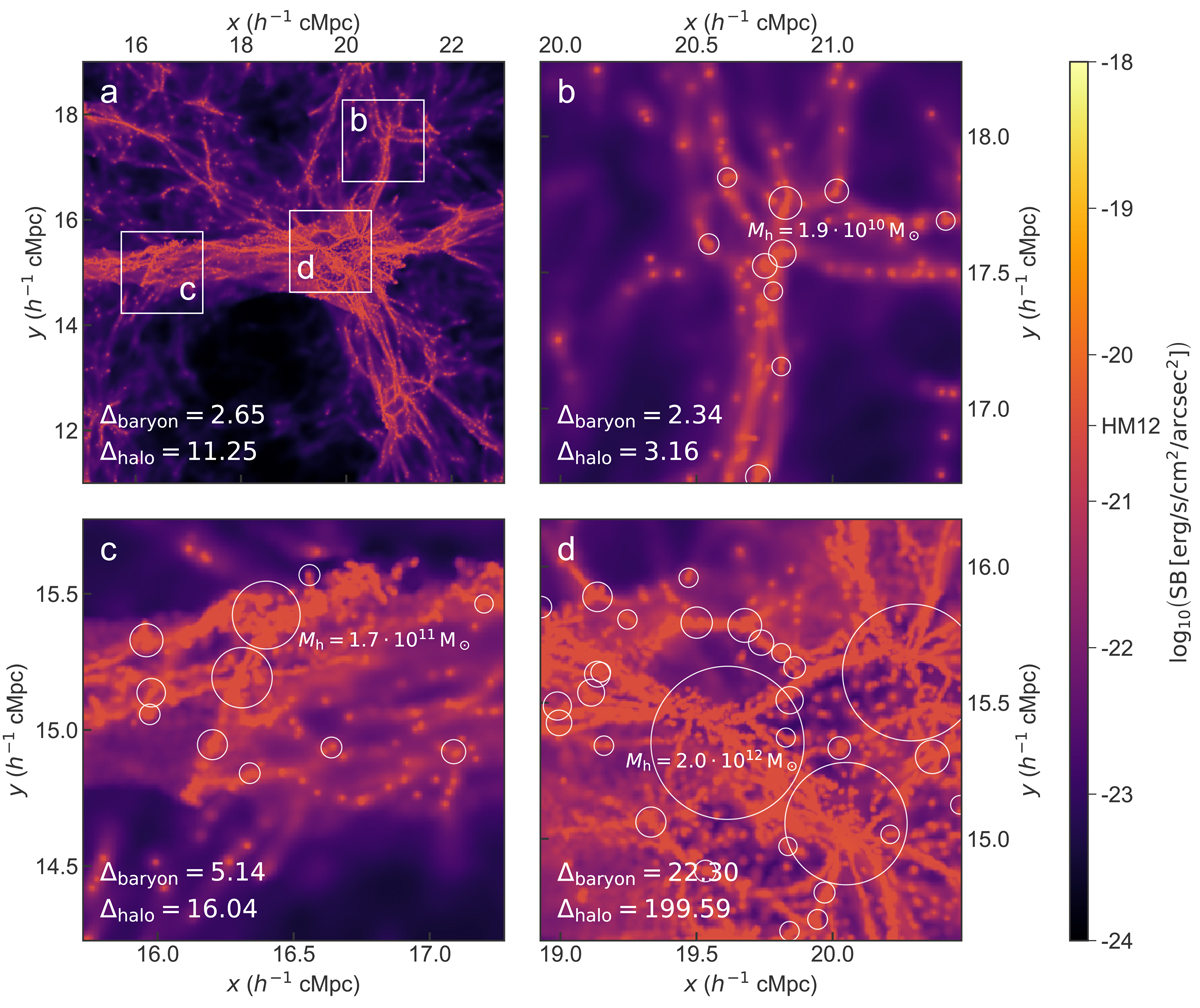
Lyα SB for a narrowband with a smaller value of Δλobs = 3.75 Å (i.e. ∼1.19 h−1 cMpc) in a simulation snapshot at z = 4.8. As in Fig. 8, the SB shown is a combination of recombination emission (of all gas in the simulation) below the mirror limit (indicated on the colour bar as HM12), and collisional excitation of gas below half the critical self-shielding density. Panel a: overview narrowband image that corresponds to region 1 in Fig. 4. This is centred on the same comoving coordinates both spatially and spectrally, but now less extended in wavelength range as the narrowband width has been decreased. This panel shows a region of 8 × 8 h−2 cMpc2 (5.2 × 5.2 arcmin2) on a pixel grid of 1024 × 1024. Panels b–d: Lyα narrowband images the size of 1 × 1 arcmin2 consisting of 300 × 300 pixels (as the FOV of MUSE). The volume probed by one of these narrowband images at this redshift is 2.84 h−3 cMpc3. The areas covered by these maps are indicated by the white squares in the overview panel a. Halos with halo mass of Mh > 109.5 M⊙ are shown as circles, their size indicating their projected virial radius (see text). The most massive halo in each panel is annotated. In the bottom left corner of each panel, two different measures of the overdensity of the region are shown (see text for more details). The baryonic overdensity is calculated taking all gas into account, even though only gas below a certain density contributes to the collisional excitation.
Current usage metrics show cumulative count of Article Views (full-text article views including HTML views, PDF and ePub downloads, according to the available data) and Abstracts Views on Vision4Press platform.
Data correspond to usage on the plateform after 2015. The current usage metrics is available 48-96 hours after online publication and is updated daily on week days.
Initial download of the metrics may take a while.