Fig. 7.
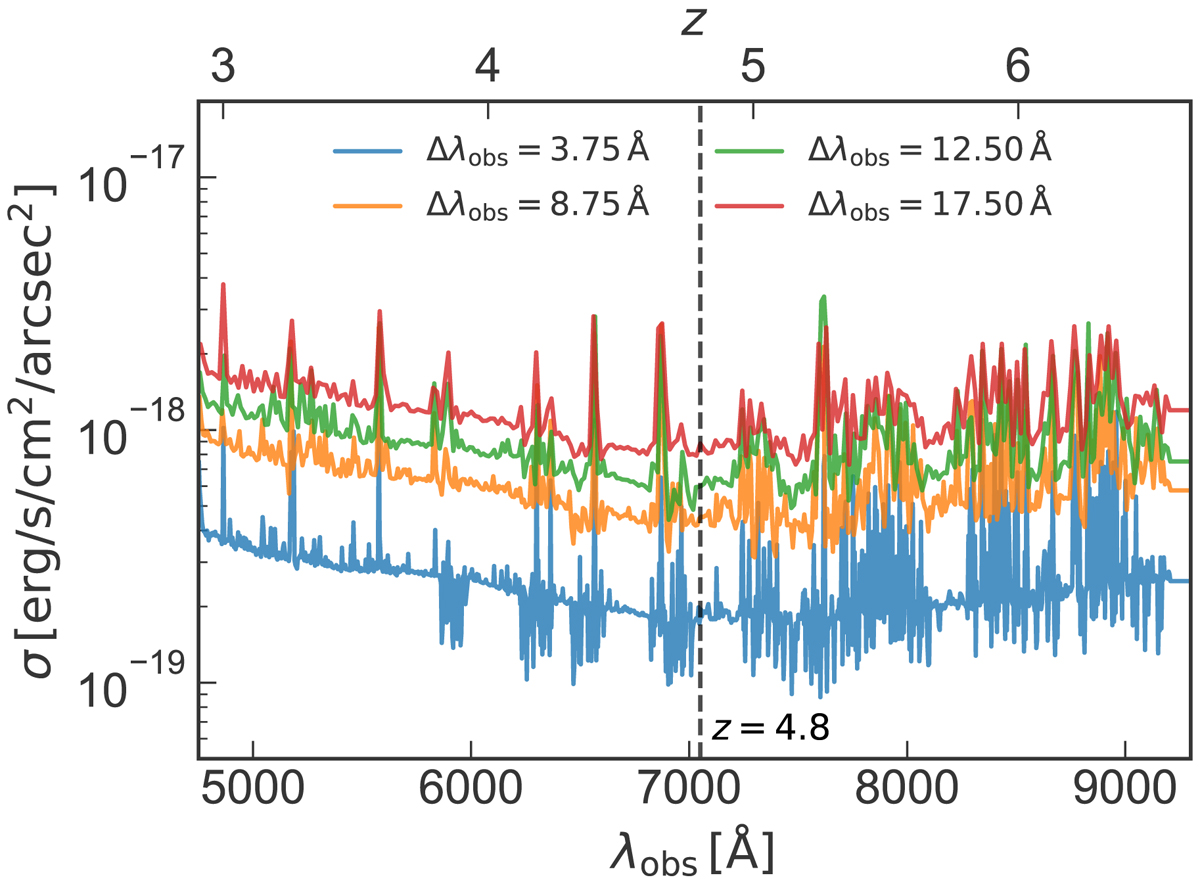
Inferred noise in the MUSE HDFS observation as a function of observed wavelength or redshift for different pseudo-narrowband widths: Δλobs = 3.75 Å, Δλobs = 8.75 Å, Δλobs = 12.50 Å, and Δλobs = 17.50 Å. Skylines result in increased noise in some spectral ranges. The vertical dashed line indicates the position of Lyα at z = 4.8, which is located in a spectral window with lower noise. The throughput of MUSE is at its maximum of ∼40% at ∼ 7200 Å (e.g., Richard et al. 2019).
Current usage metrics show cumulative count of Article Views (full-text article views including HTML views, PDF and ePub downloads, according to the available data) and Abstracts Views on Vision4Press platform.
Data correspond to usage on the plateform after 2015. The current usage metrics is available 48-96 hours after online publication and is updated daily on week days.
Initial download of the metrics may take a while.