Fig. 6.
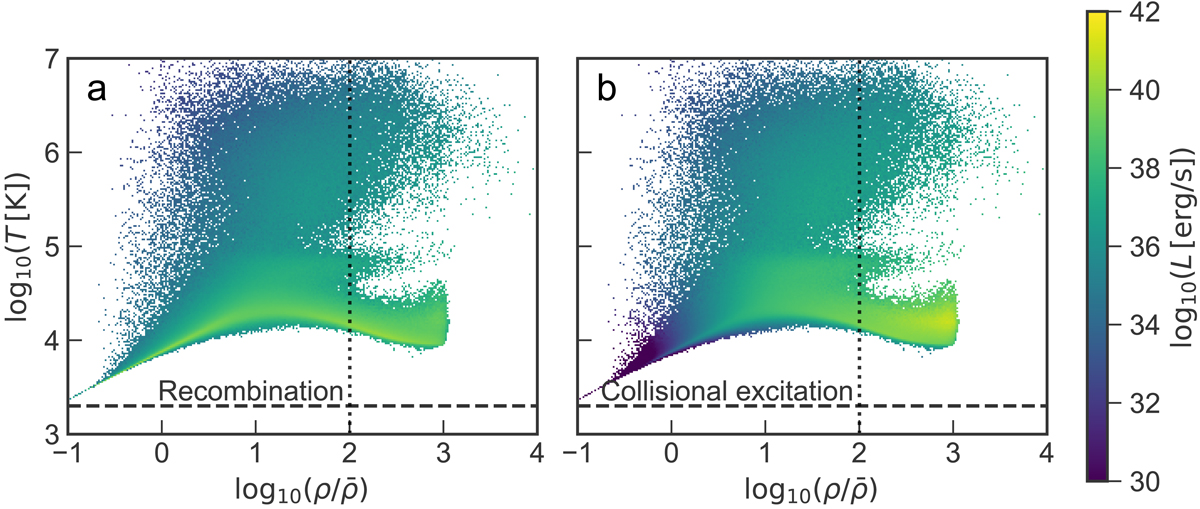
Histogram of Lyα luminosities of recombination (panel a) and collisional excitation (panel b) processes in the same region as shown in Fig. 5 (a narrowband with Δλobs = 8.75 Å, equivalent to ∼2.7 h−1 cMpc) in a simulation snapshot at z = 4.8 in phase space. The colour represents the total luminosity in the simulation per histogram bin. The horizontal dashed line corresponds to the lower limit above which the fitting function of Scholz et al. (1990) and Scholz & Walters (1991) for collisionally excited Lyα emission is valid; the upper limit lies above the plotted range. The vertical dotted line shows the critical self-shielding density threshold at this redshift for the HM12 UVB (from Eq. (13) in Rahmati et al. 2013). Densities above the threshold are also more strongly affected by modelling uncertainties.
Current usage metrics show cumulative count of Article Views (full-text article views including HTML views, PDF and ePub downloads, according to the available data) and Abstracts Views on Vision4Press platform.
Data correspond to usage on the plateform after 2015. The current usage metrics is available 48-96 hours after online publication and is updated daily on week days.
Initial download of the metrics may take a while.