Fig. 4.
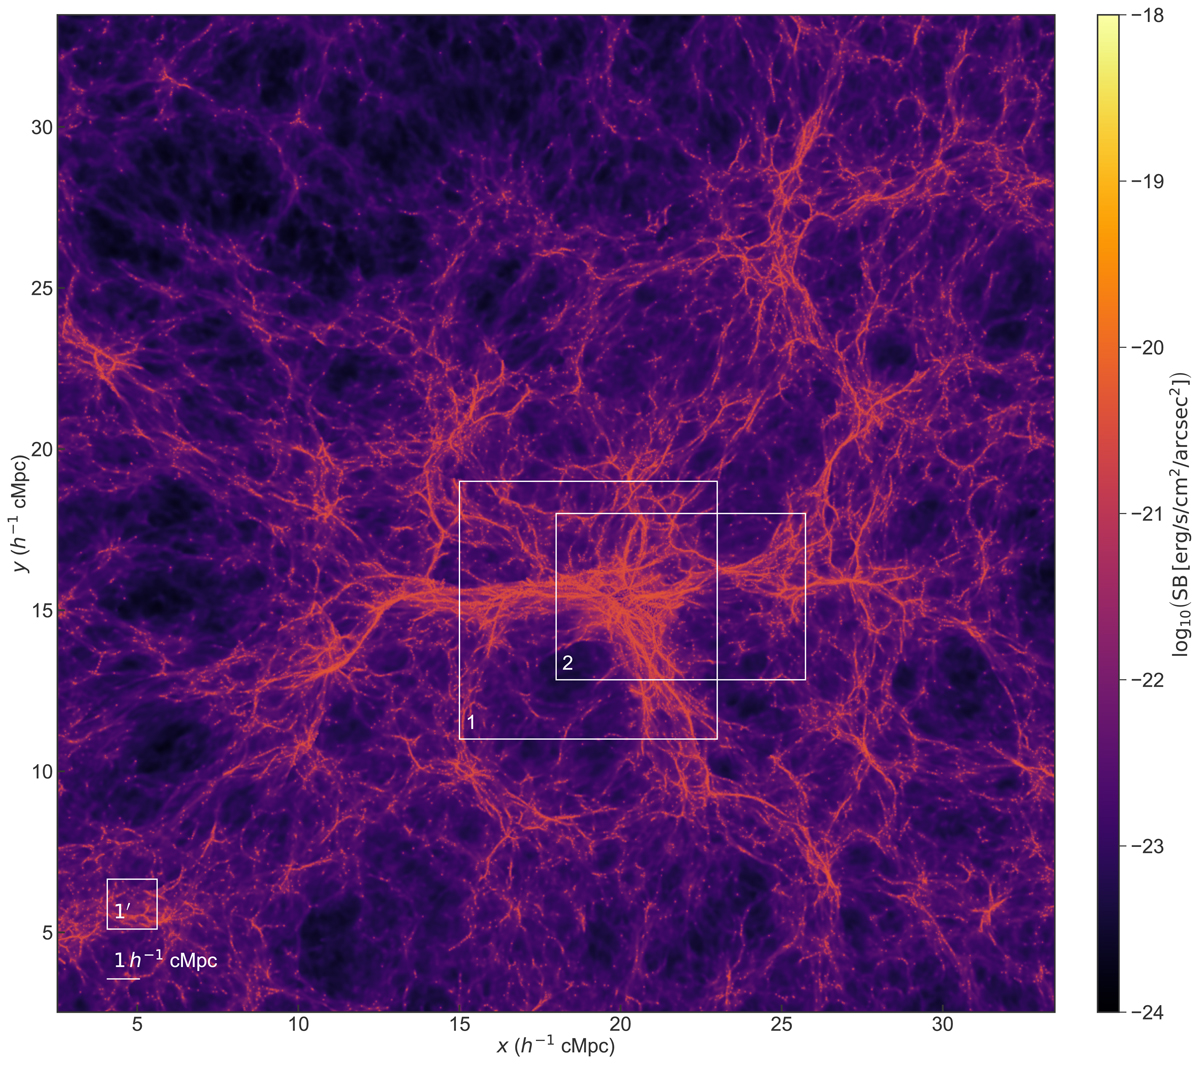
Lyα SB resulting from the combination of recombination emission (of all gas in the simulation) below the mirror limit and collisional excitation of gas below half the critical self-shielding density, covering an area of 20 × 20 arcmin2, or 31.0 × 31.0 h−2 cMpc2, in a narrowband with Δλobs = 8.75 Å (corresponding to ∼2.7 h−1 cMpc) in a simulation snapshot at z = 4.8. The images are made by the projection method (Sect. 2.4.1) onto a pixel grid of 6000 × 6000; this is the same pixel size as MUSE, making this image the equivalent of a mosaic of 20 × 20 MUSE pointings (more details on MUSE follow in Sect. 3.3). Regions 1 and 2, indicated by the white rectangles, will be studied in more detail later. Also shown in the bottom left corner are the scales of the MUSE FOV (1 × 1 arcmin2) and 1 h−1 cMpc.
Current usage metrics show cumulative count of Article Views (full-text article views including HTML views, PDF and ePub downloads, according to the available data) and Abstracts Views on Vision4Press platform.
Data correspond to usage on the plateform after 2015. The current usage metrics is available 48-96 hours after online publication and is updated daily on week days.
Initial download of the metrics may take a while.