Fig. 3.
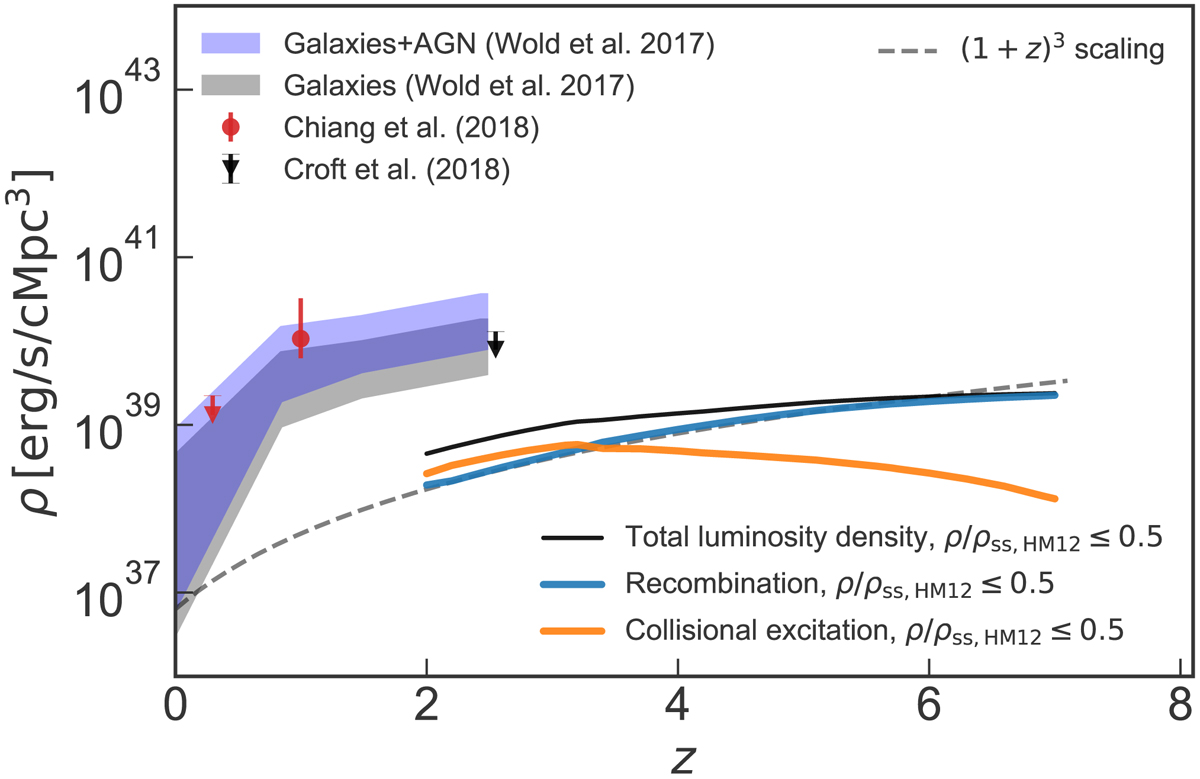
Redshift evolution of the comoving Lyα luminosity density. The blue and orange lines show the results for recombination and collisional excitation emission for gas at densities below half the critical self-shielding density roughly corresponding to the IGM at an overdensity ![]() at z = 4.8 (see Sect. 2.2.2). The black line shows the total luminosity density for gas below this density threshold; all these follow from the simulation run with a box size of 40 h−1 cMpc and resolution of 2 × 10243 particles (see Sect. 2.4 for more details on the simulation). Observational measurements at low redshift (z < 3), as presented in Chiang et al. (2019), have been included as a reference. These consist of luminosity densities of just galaxies and the contribution of galaxies and AGN (shown as the grey and blue shaded areas, respectively) inferred by Chiang et al. (2019) from the intrinsic luminosity density presented in Wold et al. (2017); the measurement and upper limit from Chiang et al. (2019) are shown in red, and the upper limit from Croft et al. (2018) (converted to a luminosity density by Chiang et al. 2019) is shown in black (see text for details). Data points are shown as circles, upper limits as downward triangles. Also shown is the (1 + z)3 scaling relation for recombination emission discussed in the text.
at z = 4.8 (see Sect. 2.2.2). The black line shows the total luminosity density for gas below this density threshold; all these follow from the simulation run with a box size of 40 h−1 cMpc and resolution of 2 × 10243 particles (see Sect. 2.4 for more details on the simulation). Observational measurements at low redshift (z < 3), as presented in Chiang et al. (2019), have been included as a reference. These consist of luminosity densities of just galaxies and the contribution of galaxies and AGN (shown as the grey and blue shaded areas, respectively) inferred by Chiang et al. (2019) from the intrinsic luminosity density presented in Wold et al. (2017); the measurement and upper limit from Chiang et al. (2019) are shown in red, and the upper limit from Croft et al. (2018) (converted to a luminosity density by Chiang et al. 2019) is shown in black (see text for details). Data points are shown as circles, upper limits as downward triangles. Also shown is the (1 + z)3 scaling relation for recombination emission discussed in the text.
Current usage metrics show cumulative count of Article Views (full-text article views including HTML views, PDF and ePub downloads, according to the available data) and Abstracts Views on Vision4Press platform.
Data correspond to usage on the plateform after 2015. The current usage metrics is available 48-96 hours after online publication and is updated daily on week days.
Initial download of the metrics may take a while.