Fig. A.3.
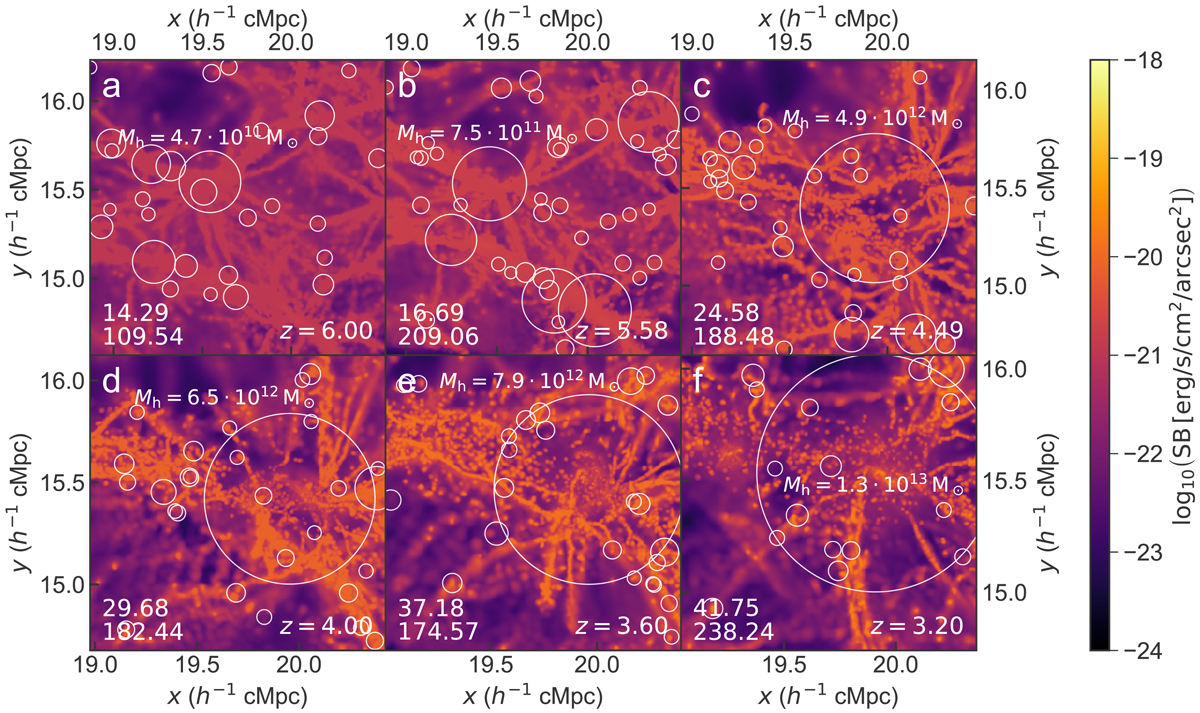
Lyα SB for a combination of recombination emission (of all gas in the simulation) below the mirror limit and collisional excitation of gas below half the critical self-shielding density at different redshifts. Both the mirror limit and the critical self-shielding density evolve as a function of redshift (see Fig. 1). The panels show snapshots at redshifts of z = 6.00, z = 5.58, z = 4.49, z = 4.00, z = 3.60, z = 3.20 for a narrowband with Δλobs = 3.75 Å; at z = 5.76; this corresponds to ∼1.19 h−1 cMpc, but this again changes with redshift. The panels all display a pixel grid of 300 × 300 and the angular size of the MUSE FOV (1 × 1 arcmin2), which translates to different physical sizes at each corresponding redshift. The regions are all centred at the same comoving transverse coordinates as panel d in Figs. 8 and 10; however, the narrowband centre (the coordinate along the line of sight) has been chosen to coincide with the most massive halo in each panel to ensure the entire filament is captured in each panel. The two numbers in the bottom left corner show the same two different measures of the overdensity of the region, Δbaryon and Δhalo (see Sect. 3.4.1 for more details). Halos with halo mass of Mh > 109.5 M⊙ are shown as circles, their size indicating their projected virial radius. The most massive halo in each panel is annotated. The scale varies between different panels since the angular size is kept constant across all redshifts.
Current usage metrics show cumulative count of Article Views (full-text article views including HTML views, PDF and ePub downloads, according to the available data) and Abstracts Views on Vision4Press platform.
Data correspond to usage on the plateform after 2015. The current usage metrics is available 48-96 hours after online publication and is updated daily on week days.
Initial download of the metrics may take a while.