Fig. A.2.
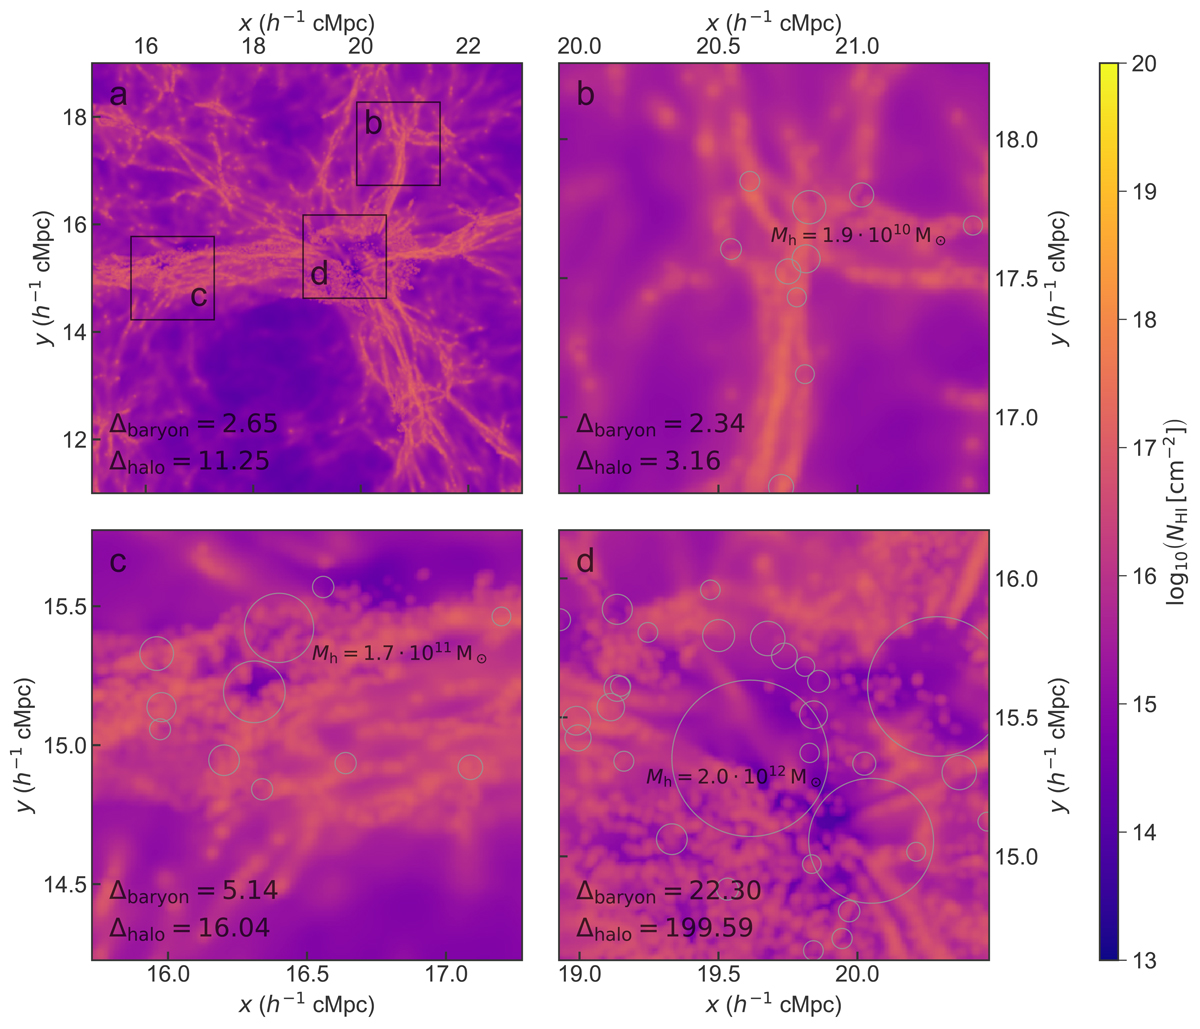
Simulated column density of neutral hydrogen, NHI, in a simulation snapshot at z = 4.8. The same regions as in Fig. 8 are shown. Moreover, the same density thresholds used for the collisional excitation component are applied, that is only gas below half the critical self-shielding density is shown, meaning this is the column density that would correspond to a narrowband image of the low-density gas with Δλobs = 3.75 Å (∼1.19 h−1 cMpc). Panel a: overview of part of the simulation snapshot that corresponds to region 1 in Fig. 4. This is centred on the same comoving coordinates both spatially and spectrally, but now less extended in wavelength range. This panel shows a region of 8 × 8 h−2 cMpc2 (5.2 × 5.2 arcmin2) on a pixel grid of 1024 × 1024. Panels b–d: column density maps of neutral hydrogen the size of the MUSE FOV consisting of 300 × 300 pixels. The areas covered by these maps are indicated by the black squares in the overview panel a. In the bottom left corner of each panel, two different measures of the overdensity of the region are shown (see Sect. 3.4 for more details). In panels b–d, halos with halo mass of Mh > 109.5 M⊙ are shown as circles, their size indicating their projected virial radius (see Sect. 3.4). The most massive halo in each panel is annotated.
Current usage metrics show cumulative count of Article Views (full-text article views including HTML views, PDF and ePub downloads, according to the available data) and Abstracts Views on Vision4Press platform.
Data correspond to usage on the plateform after 2015. The current usage metrics is available 48-96 hours after online publication and is updated daily on week days.
Initial download of the metrics may take a while.