Fig. A.1.
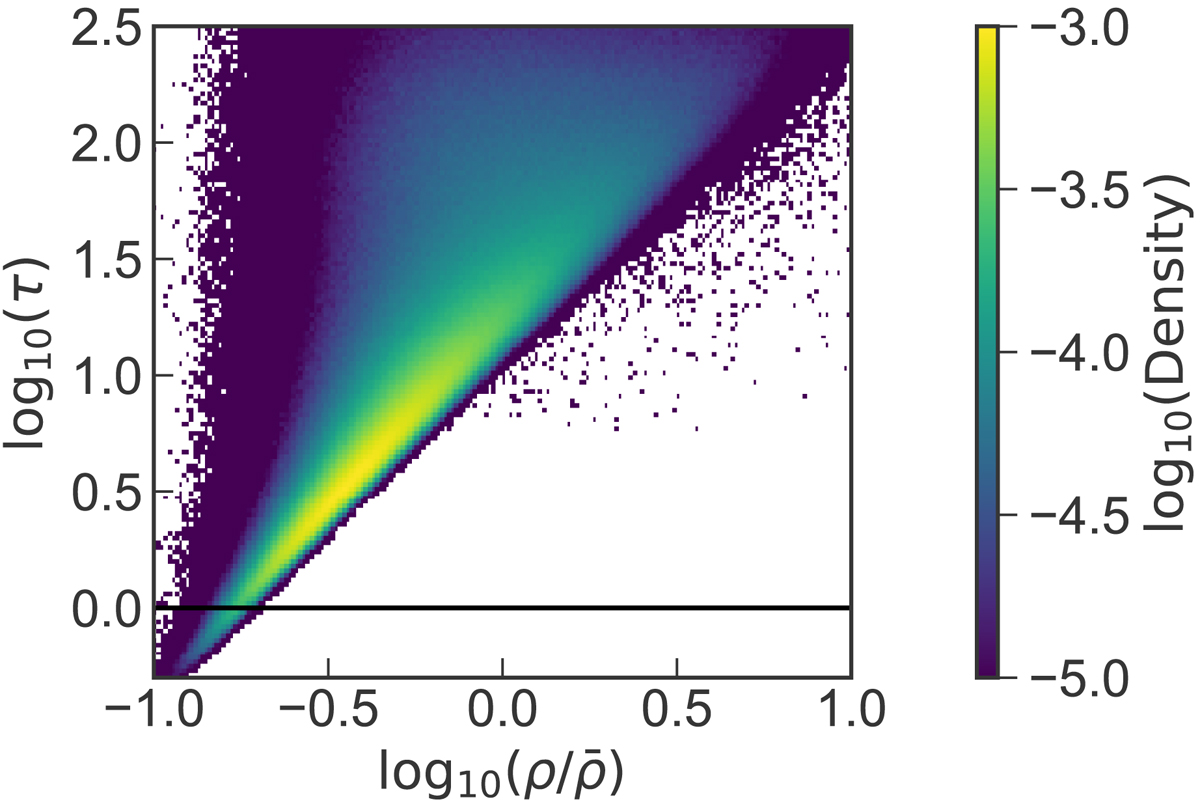
Two-dimensional density histogram for each of 2048 pixels in spectra along 5000 (randomly selected) lines of sight at z = 4.8, as a function of the Lyα optical depth τ and overdensity ![]() in the sightline; the two parameters are measured at line centre, where the optical depth was divided by 2 just to account for the hydrogen between the source and the observer (see text).
in the sightline; the two parameters are measured at line centre, where the optical depth was divided by 2 just to account for the hydrogen between the source and the observer (see text).
Current usage metrics show cumulative count of Article Views (full-text article views including HTML views, PDF and ePub downloads, according to the available data) and Abstracts Views on Vision4Press platform.
Data correspond to usage on the plateform after 2015. The current usage metrics is available 48-96 hours after online publication and is updated daily on week days.
Initial download of the metrics may take a while.