Fig. 10.
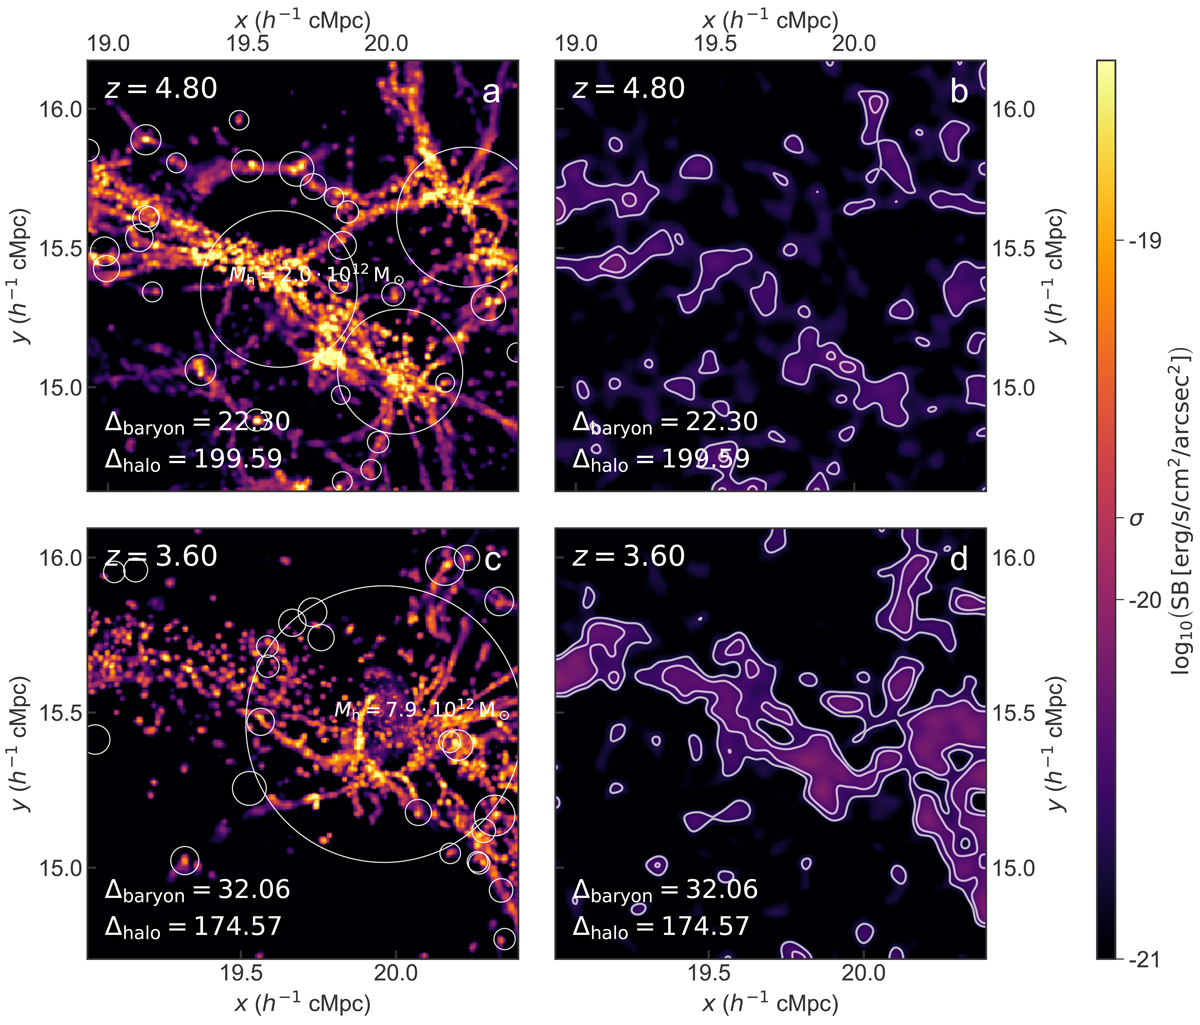
Mock observations for a MUSE-like wide-field IFU instrument on the ELT covering the same region as panel d in Fig. 8 at two different redshifts (z = 4.8 and z = 3.6 on the top and bottom row, respectively) with no limits imposed and no observational effects vs. with mirror and density limits and modelled noise and seeing applied (left and right column, respectively; see text for details). The smaller narrowband with Δλobs = 3.75 Å (i.e. ∼1.19 h−1 cMpc) has been used again. These images have a different dynamical range than all other figures to accentuate the observable Lyα signal. In panels b and d, a rebinning of 10 × 10 pixels (2 × 2 arcsec2) was applied, after which the image was smoothed on the same scale to recover the signal on larger scales. The white contours indicate measured 3σ and 5σ levels. The Lyα emission of IGM filaments can (marginally) be recovered in such an extremely deep observation and seems more feasible at low redshift when considering the robust lower limits (i.e. the mirror limit for recombinations and density threshold for collisional excitation; panel d); however, the predicted full intrinsic luminosity of filaments is notably higher at higher redshift (cf. panels a and c; see text for further discussion) but very dependent on the details of the modelling.
Current usage metrics show cumulative count of Article Views (full-text article views including HTML views, PDF and ePub downloads, according to the available data) and Abstracts Views on Vision4Press platform.
Data correspond to usage on the plateform after 2015. The current usage metrics is available 48-96 hours after online publication and is updated daily on week days.
Initial download of the metrics may take a while.