Fig. C.2
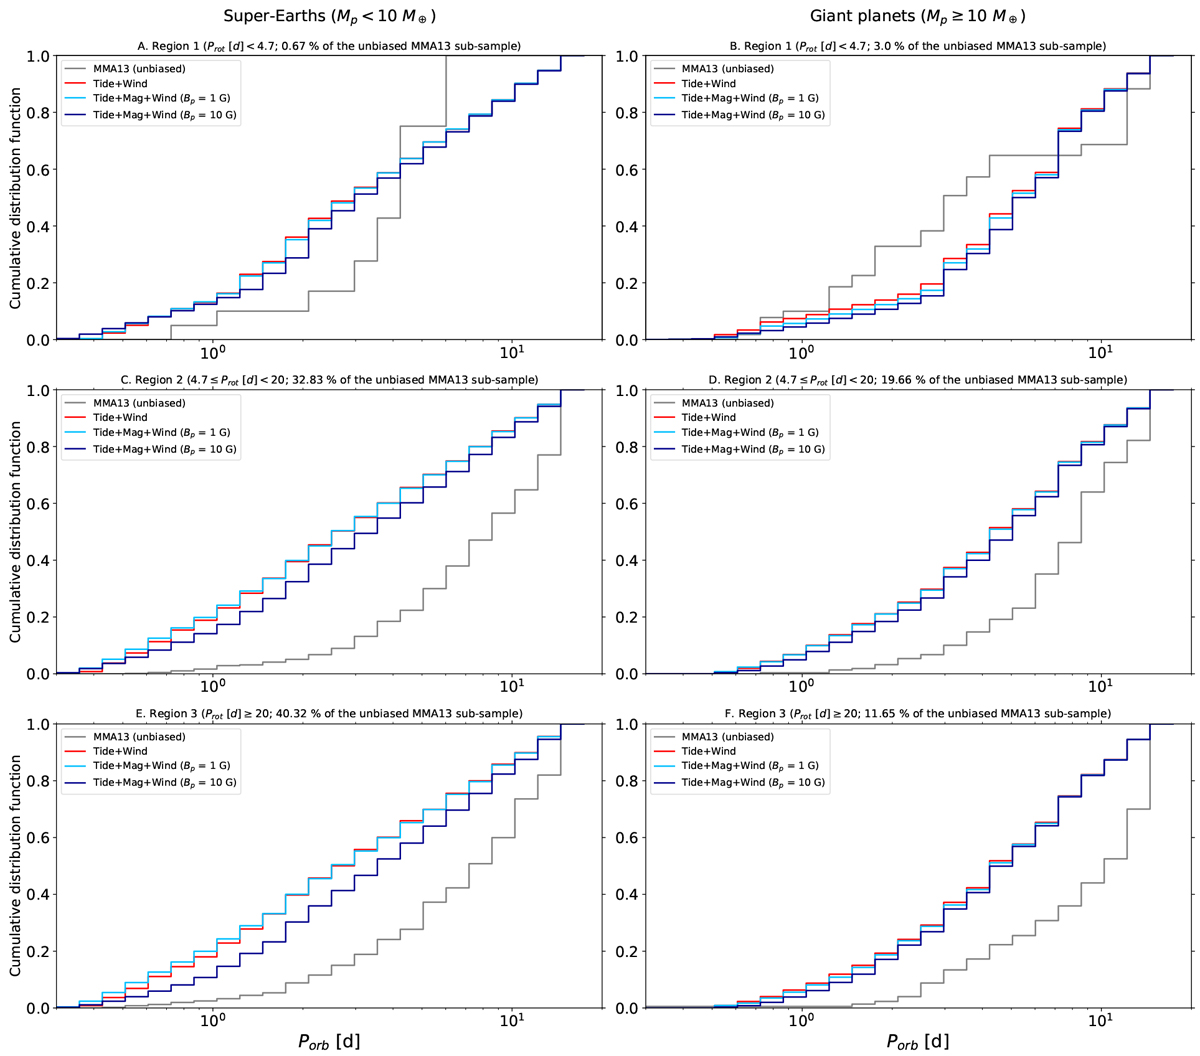
Cumulative distributions of orbital periods for super-Earths (left column) and giant planets (right column). Each row corresponds to a population of young (Region 1, for which Prot <4.7 days), middle-aged (Region 2, for which 4.7 ≤ Prot (days) < 20), and old (Region 3, Prot ≥ 20 d) star-planet systems. In gray: unbiased MMA13 sample. In red: ESPEM distributions with Bp = 0 G. In light blue: ESPEM distributions with Bp = 1 G. In dark blue: ESPEM distributions with Bp = 10 G.
Current usage metrics show cumulative count of Article Views (full-text article views including HTML views, PDF and ePub downloads, according to the available data) and Abstracts Views on Vision4Press platform.
Data correspond to usage on the plateform after 2015. The current usage metrics is available 48-96 hours after online publication and is updated daily on week days.
Initial download of the metrics may take a while.