Fig. 18
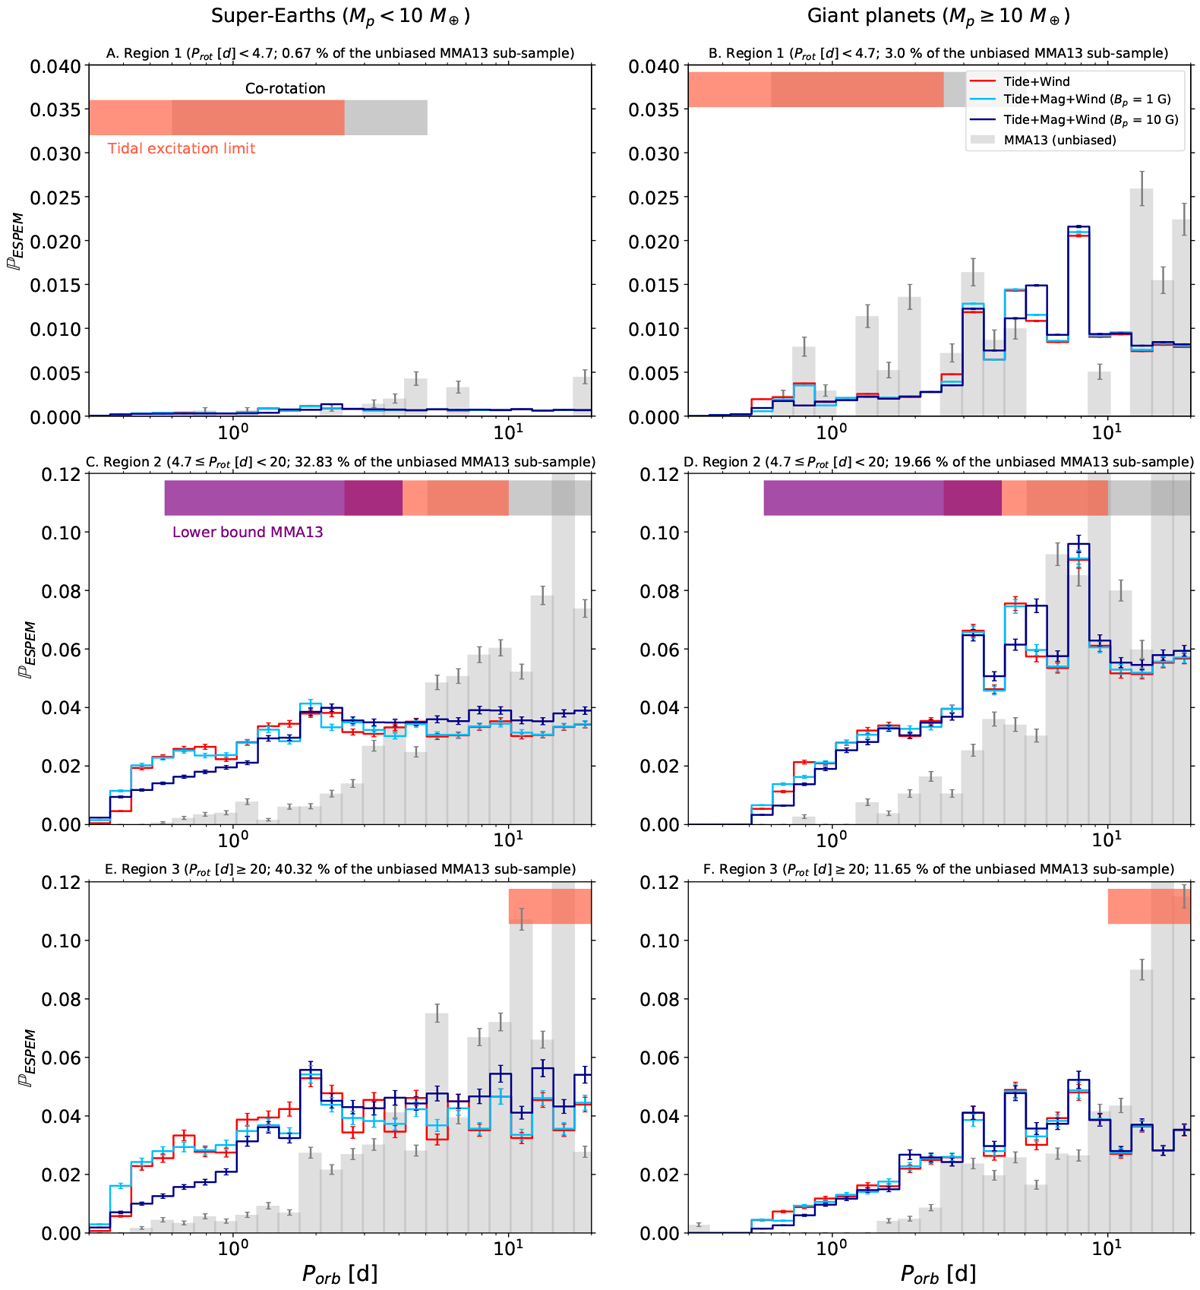
Distribution of orbital periods for super-Earths (left column) and giant planets (right column). Each row corresponds to a population of young (Region 1, for which Prot <4.7 days), middle-aged (Region 2, for which 4.7 ≤ Prot [days] < 20), and old (Region 3, Prot ≥ 20 days) star–planet systems. The gray histogram corresponds to the distributions obtained with the unbiased MMA13 sample. The ESPEM distributions with Bp = 0, 1, 10 G are shown in red, light blue and dark blue respectively. The gray, red, and purple horizontal bands at the top of each panel correspond to the range of values in each region of the co-rotation, the dynamical tide excitation limit, and the lower edge of the MMA13 distribution, respectively. The calculation of the error bars for the synthetic distributions is presented inAppendix A.
Current usage metrics show cumulative count of Article Views (full-text article views including HTML views, PDF and ePub downloads, according to the available data) and Abstracts Views on Vision4Press platform.
Data correspond to usage on the plateform after 2015. The current usage metrics is available 48-96 hours after online publication and is updated daily on week days.
Initial download of the metrics may take a while.