Fig. 16
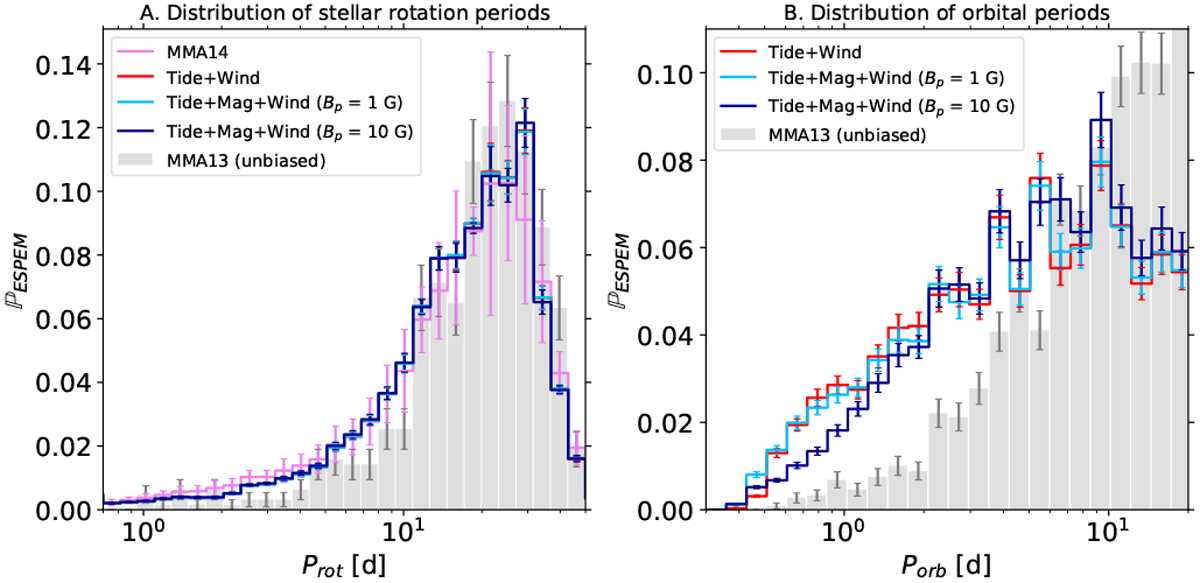
Distribution of stellar rotation periods (left) and orbital periods (right). The Prot distribution from the MMA14 study is shown in violet. The gray bars correspond to the distributions obtained with the unbiased MMA13 sample. The ESPEM distributions with Bp = 0, 1, 10 G are shownin red, light blue and dark blue respectively. The calculation of the error bars for the synthetic distributions is presented in Appendix A.
Current usage metrics show cumulative count of Article Views (full-text article views including HTML views, PDF and ePub downloads, according to the available data) and Abstracts Views on Vision4Press platform.
Data correspond to usage on the plateform after 2015. The current usage metrics is available 48-96 hours after online publication and is updated daily on week days.
Initial download of the metrics may take a while.