Fig. 11
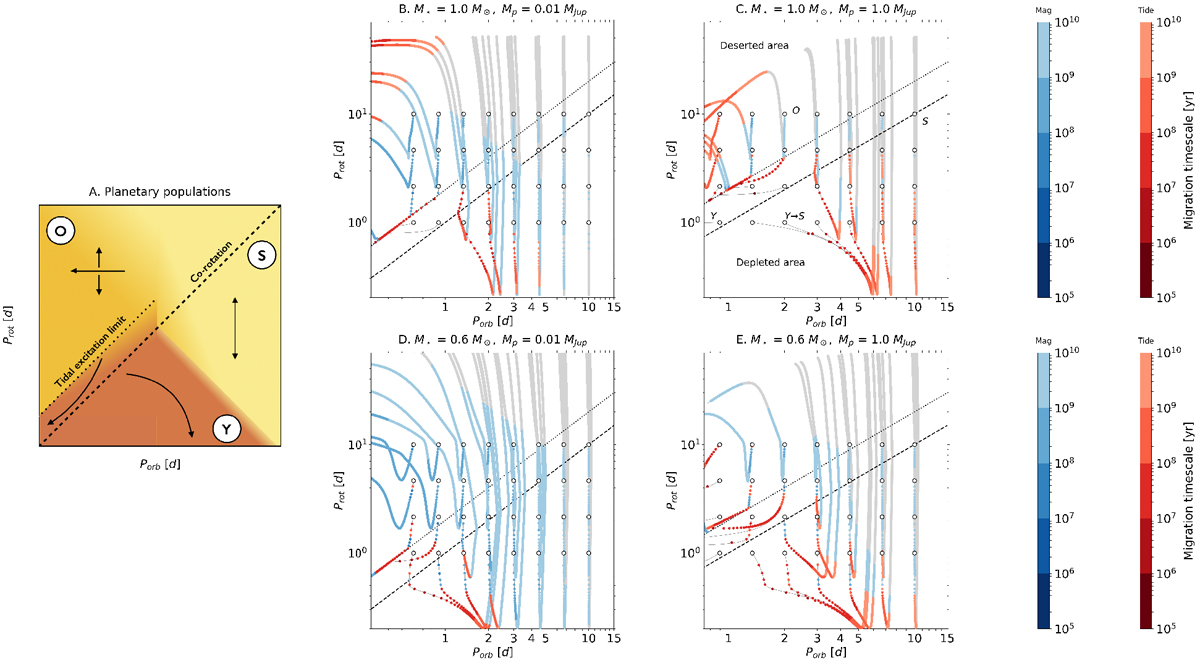
Evolution between 1 Myr and 10 Gyr of a planetary population designed from eight orbital periods Porb,ini, equally spaced in logarithm between 0.6 and 10 days, and four initial stellar rotation periods Prot,ini between 1 and 10 days. Those initial parameters correspond to the white circles. Panel A: sketch representing the evolution of the Steady population (S, in yellow), the Young Migrators (Y, in dark orange), and the Old Migrators (O, in light orange) in the (Porb, Prot) plane. The black arrows correspond to the possible paths of each population. Panel B: evolution of the planetary population for M⋆ = 1 M⊙ and Mp = 0.01 MJup. Panel C: evolution of the planetary population for M⋆ = 1 M⊙ and Mp = 1 MJup. Panel D: evolution of the planetary population for M⋆ = 0.6 M⊙ and Mp = 0.01 MJup. Panel E: evolution of the planetary population for M⋆ = 0.6 M⊙ and Mp = 1 MJup. Magnetic and tidal dominance are shown in blue and red, respectively. The shades of blue and red correspond to the overall migration timescale of the system, displayed in logarithmic scale (see key on the right). Regions where the overall migration timescale is greater than the age of the Universe are shown in gray. The black dashed line corresponds to co-rotation and the black dotted line to the tidal excitation limit.
Current usage metrics show cumulative count of Article Views (full-text article views including HTML views, PDF and ePub downloads, according to the available data) and Abstracts Views on Vision4Press platform.
Data correspond to usage on the plateform after 2015. The current usage metrics is available 48-96 hours after online publication and is updated daily on week days.
Initial download of the metrics may take a while.