Free Access
Fig. 6.
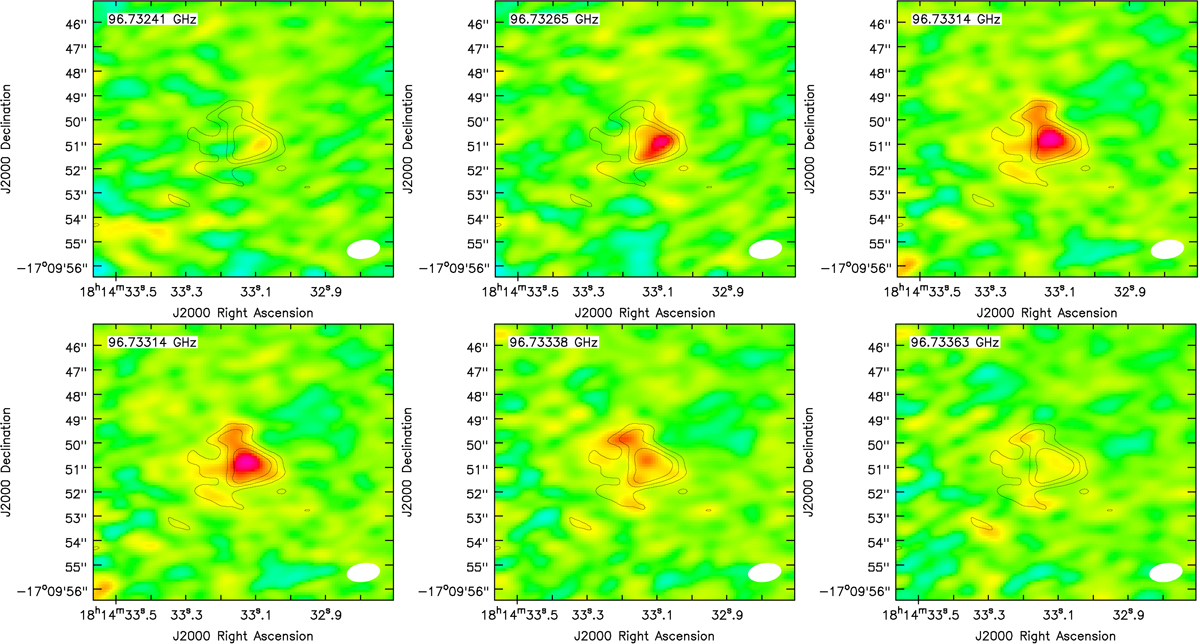
Detail of regions showing line emission in the field of view of GX 13+1: channel map at the SE position for the line centred at 96.7329 GHz. The contours show the integrated intensity after primary beam correction within the frequency range indicated in the first column of Table 6.
Current usage metrics show cumulative count of Article Views (full-text article views including HTML views, PDF and ePub downloads, according to the available data) and Abstracts Views on Vision4Press platform.
Data correspond to usage on the plateform after 2015. The current usage metrics is available 48-96 hours after online publication and is updated daily on week days.
Initial download of the metrics may take a while.