Fig. 4.
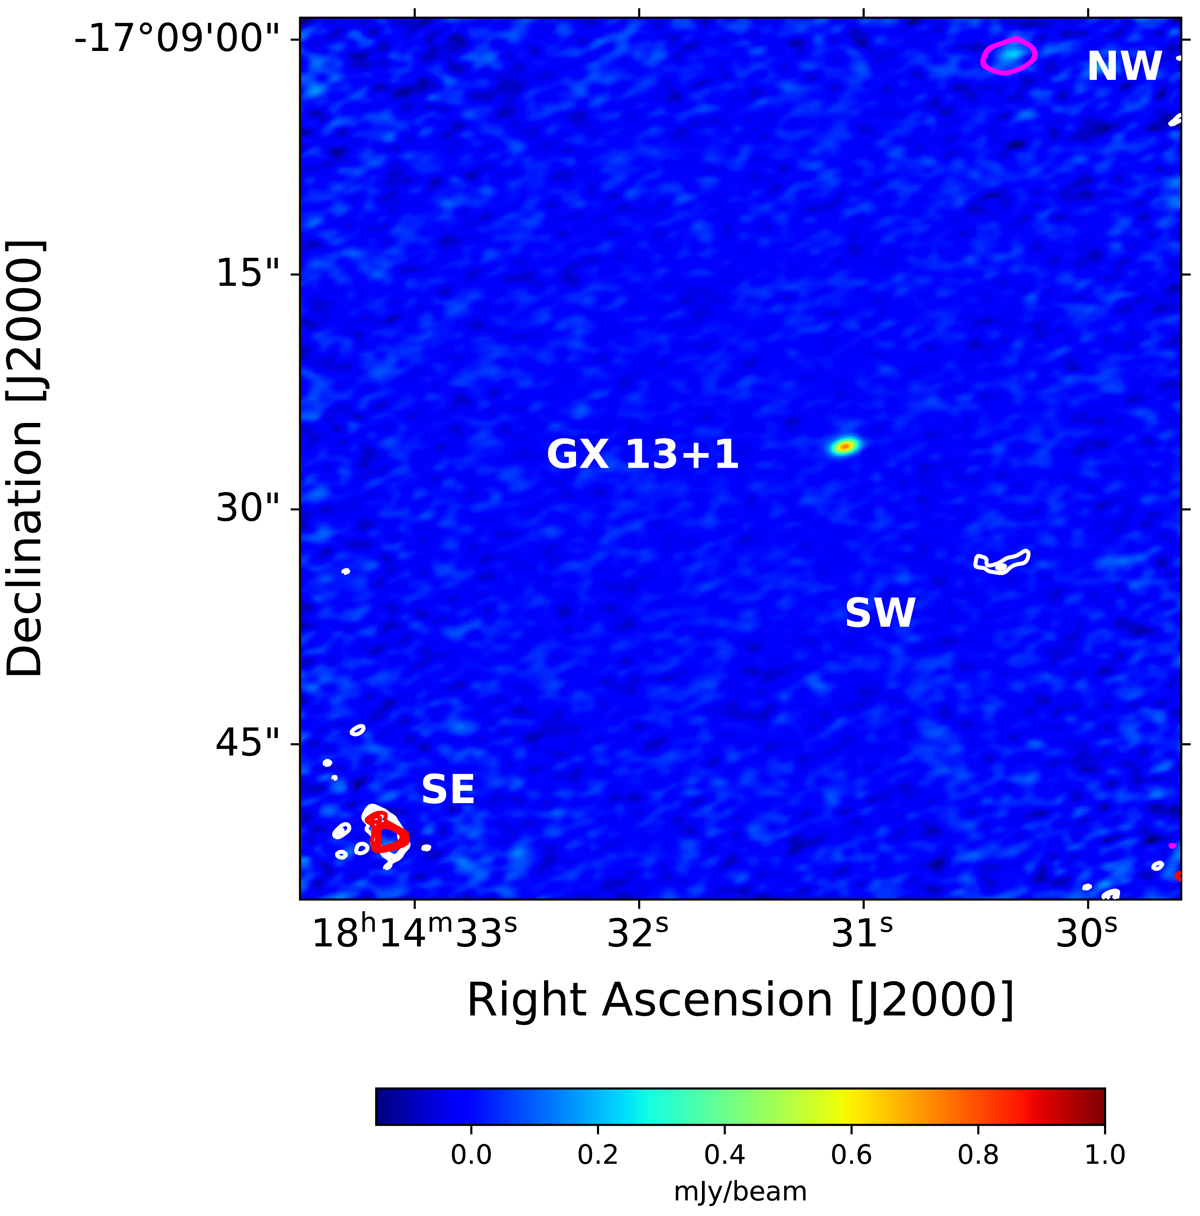
Continuum emission (coloured image) associated with the relativistic jet at the position of GX 13+1. The contours show the integrated intensity maps at the frequency of the lines detected around GX 13+1 (see Fig. 5 and Table 6 for details). The emission lines at each position are shown in Fig. 5. Magenta, red, and white contours correspond to the lines at 86.23, 96.73, and 99.29 GHz, respectively. The excess in the average continuum map of GX 13+1 at the NW position is due exclusively to the line emission at that position.
Current usage metrics show cumulative count of Article Views (full-text article views including HTML views, PDF and ePub downloads, according to the available data) and Abstracts Views on Vision4Press platform.
Data correspond to usage on the plateform after 2015. The current usage metrics is available 48-96 hours after online publication and is updated daily on week days.
Initial download of the metrics may take a while.