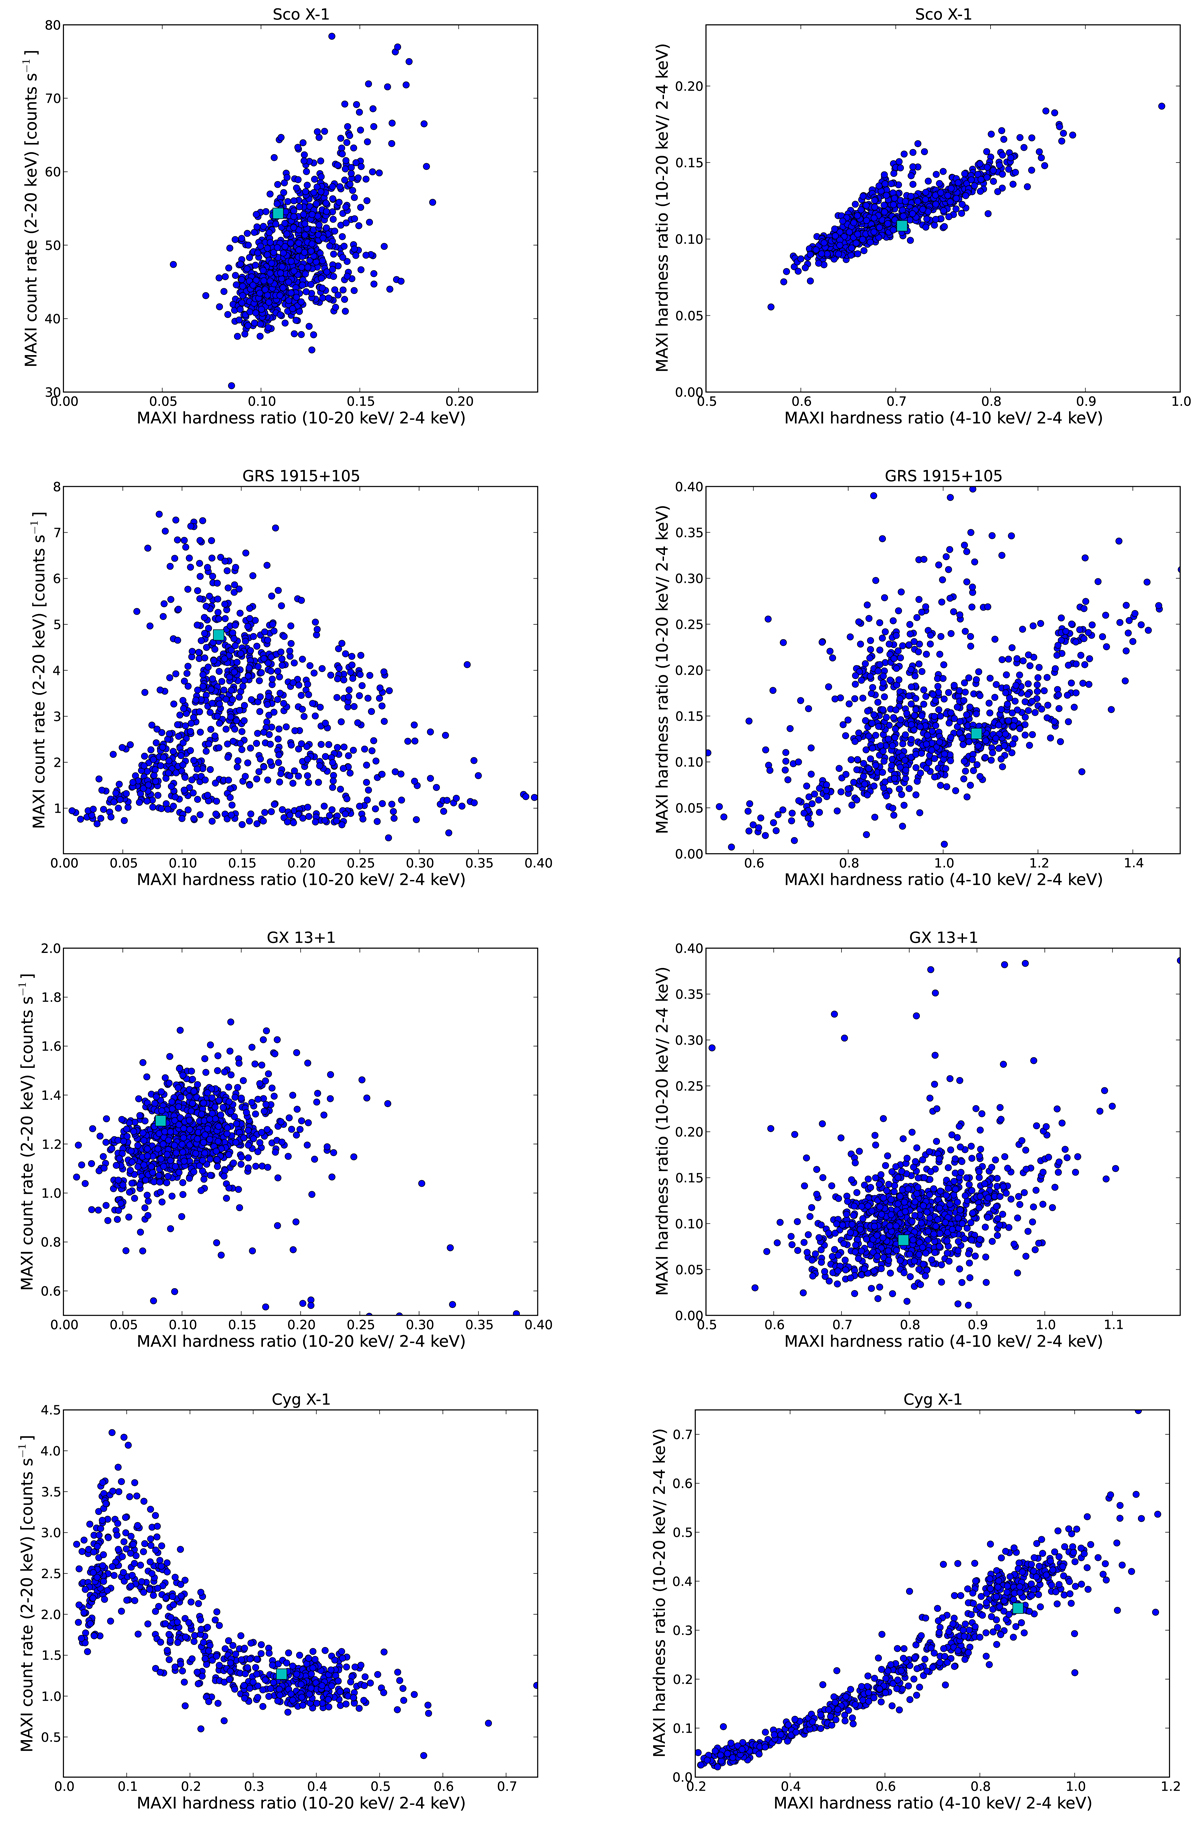
Fig. A.1.

Hardness–intensity (left) and colour–colour (right) diagrams based on MAXI data. Blue circles represent all MAXI daily measurements for each source in the shown energy range and between MJD 57000 and 58000 (as representative from the MAXI lifetime). The cyan square point is the MAXI daily measurement at the time when the ALMA observation for each source was performed (see Table 1). For Cyg X-1 there were no MAXI data available on the day of the first observation, and consequently only the second observation is shown.
Current usage metrics show cumulative count of Article Views (full-text article views including HTML views, PDF and ePub downloads, according to the available data) and Abstracts Views on Vision4Press platform.
Data correspond to usage on the plateform after 2015. The current usage metrics is available 48-96 hours after online publication and is updated daily on week days.
Initial download of the metrics may take a while.


