Fig. 9.
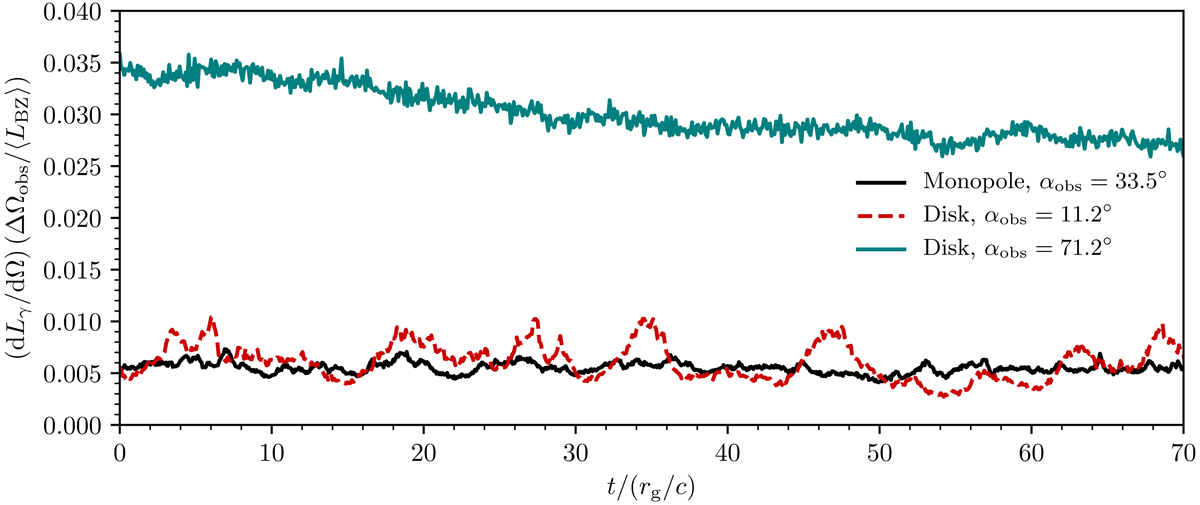
Light curve for the monopole simulation at τ0 = 30 (described in C20), normalized by ![]() , at αobs = 33.5° (black solid line), and light curves for the disk simulation with τ0 = 50 and V0/c = 0.05 at two different viewing angles: αobs = 11.2° (red dashed line) and αobs = 71.2° (blue solid line). These two light curves are normalized by the time-averaged value of LBZ shown in Fig. 8.
, at αobs = 33.5° (black solid line), and light curves for the disk simulation with τ0 = 50 and V0/c = 0.05 at two different viewing angles: αobs = 11.2° (red dashed line) and αobs = 71.2° (blue solid line). These two light curves are normalized by the time-averaged value of LBZ shown in Fig. 8.
Current usage metrics show cumulative count of Article Views (full-text article views including HTML views, PDF and ePub downloads, according to the available data) and Abstracts Views on Vision4Press platform.
Data correspond to usage on the plateform after 2015. The current usage metrics is available 48-96 hours after online publication and is updated daily on week days.
Initial download of the metrics may take a while.