Fig. 8.
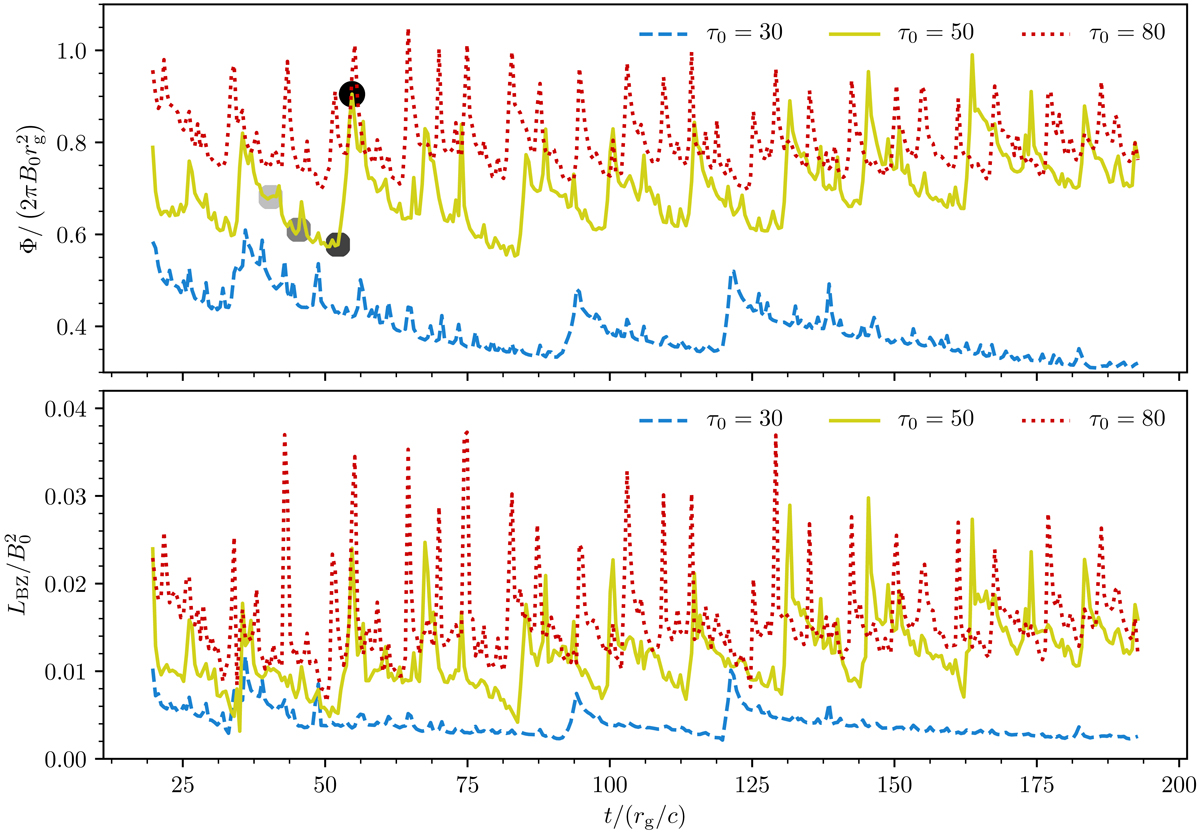
Time evolution of the normalized magnetic flux ![]() through the upper hemisphere of the event horizon (upper panel) and of the normalized Poynting flux
through the upper hemisphere of the event horizon (upper panel) and of the normalized Poynting flux ![]() , integrated over the event horizon (lower panel), for the three simulations at V0/c = 0.05. The black disks, relative to the τ0 = 50 simulation, indicate the times of the snapshots relative to Fig. 4.
, integrated over the event horizon (lower panel), for the three simulations at V0/c = 0.05. The black disks, relative to the τ0 = 50 simulation, indicate the times of the snapshots relative to Fig. 4.
Current usage metrics show cumulative count of Article Views (full-text article views including HTML views, PDF and ePub downloads, according to the available data) and Abstracts Views on Vision4Press platform.
Data correspond to usage on the plateform after 2015. The current usage metrics is available 48-96 hours after online publication and is updated daily on week days.
Initial download of the metrics may take a while.