Fig. 3.
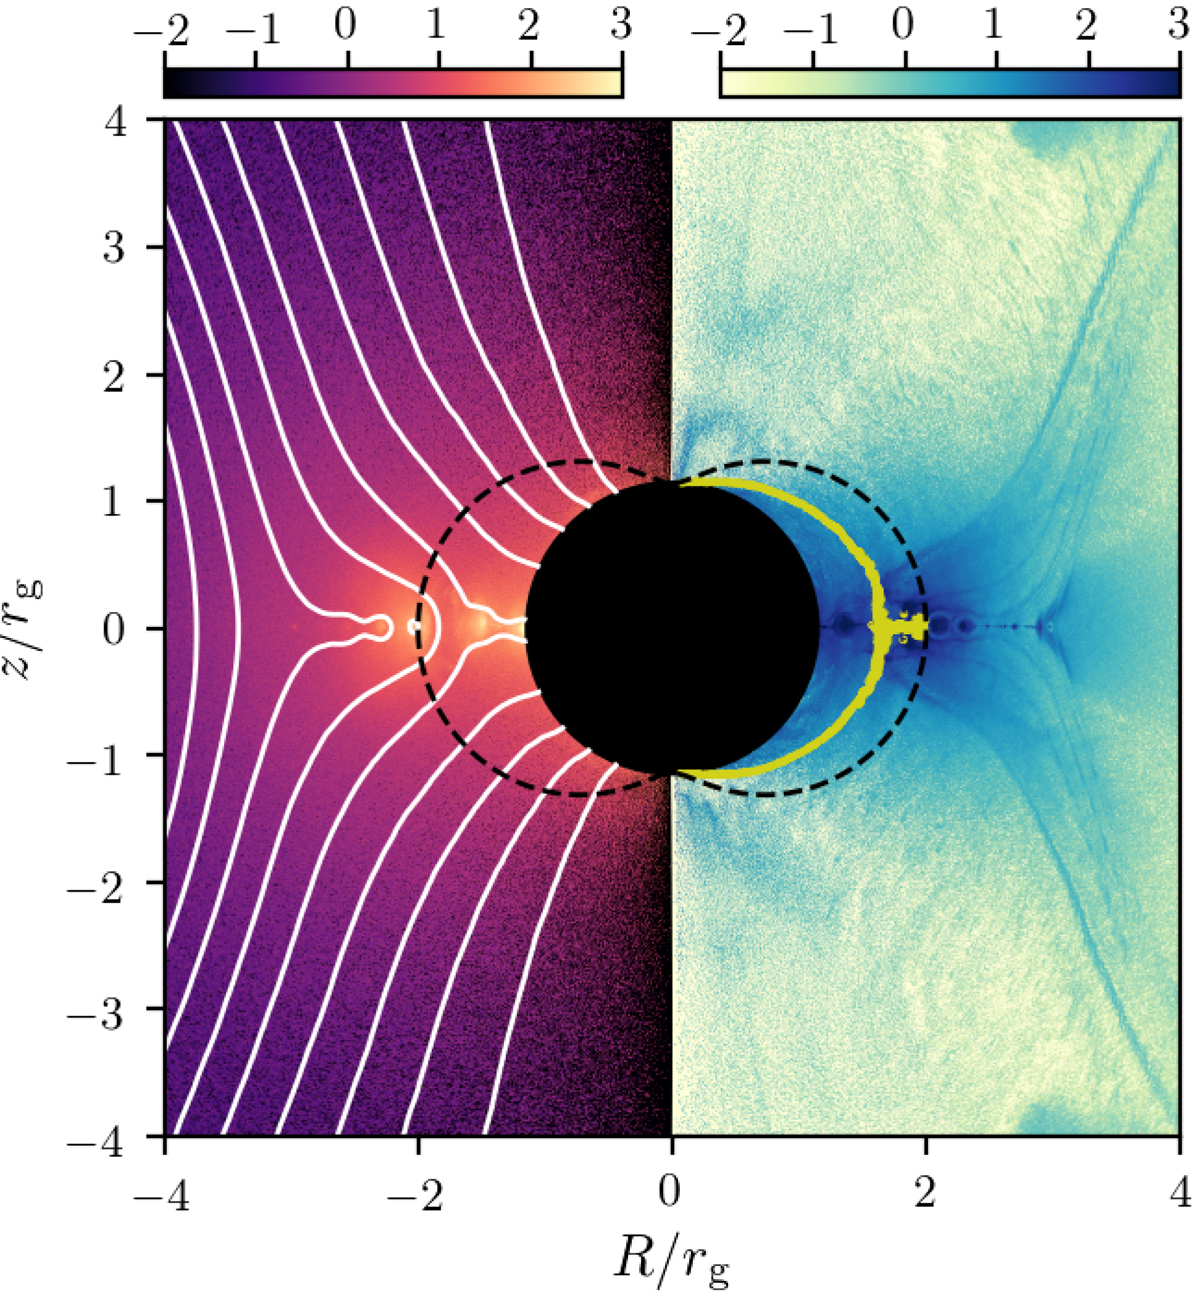
Snapshot of the simulation with τ0 = 50 and V0/c = 0.05 at t = 126 rg/c. Left panel: logarithm of the normalized density of photons above the threshold, normalized by nGJ. Poloidal magnetic field lines are represented by white solid lines. Right panel: logarithm of the normalized plasma density, normalized by nGJ. The dashed black line indicates the surface of the ergosphere, and the yellow solid line on the right panel shows the inner light surface. A movie is available online.
Current usage metrics show cumulative count of Article Views (full-text article views including HTML views, PDF and ePub downloads, according to the available data) and Abstracts Views on Vision4Press platform.
Data correspond to usage on the plateform after 2015. The current usage metrics is available 48-96 hours after online publication and is updated daily on week days.
Initial download of the metrics may take a while.