Fig. 2.
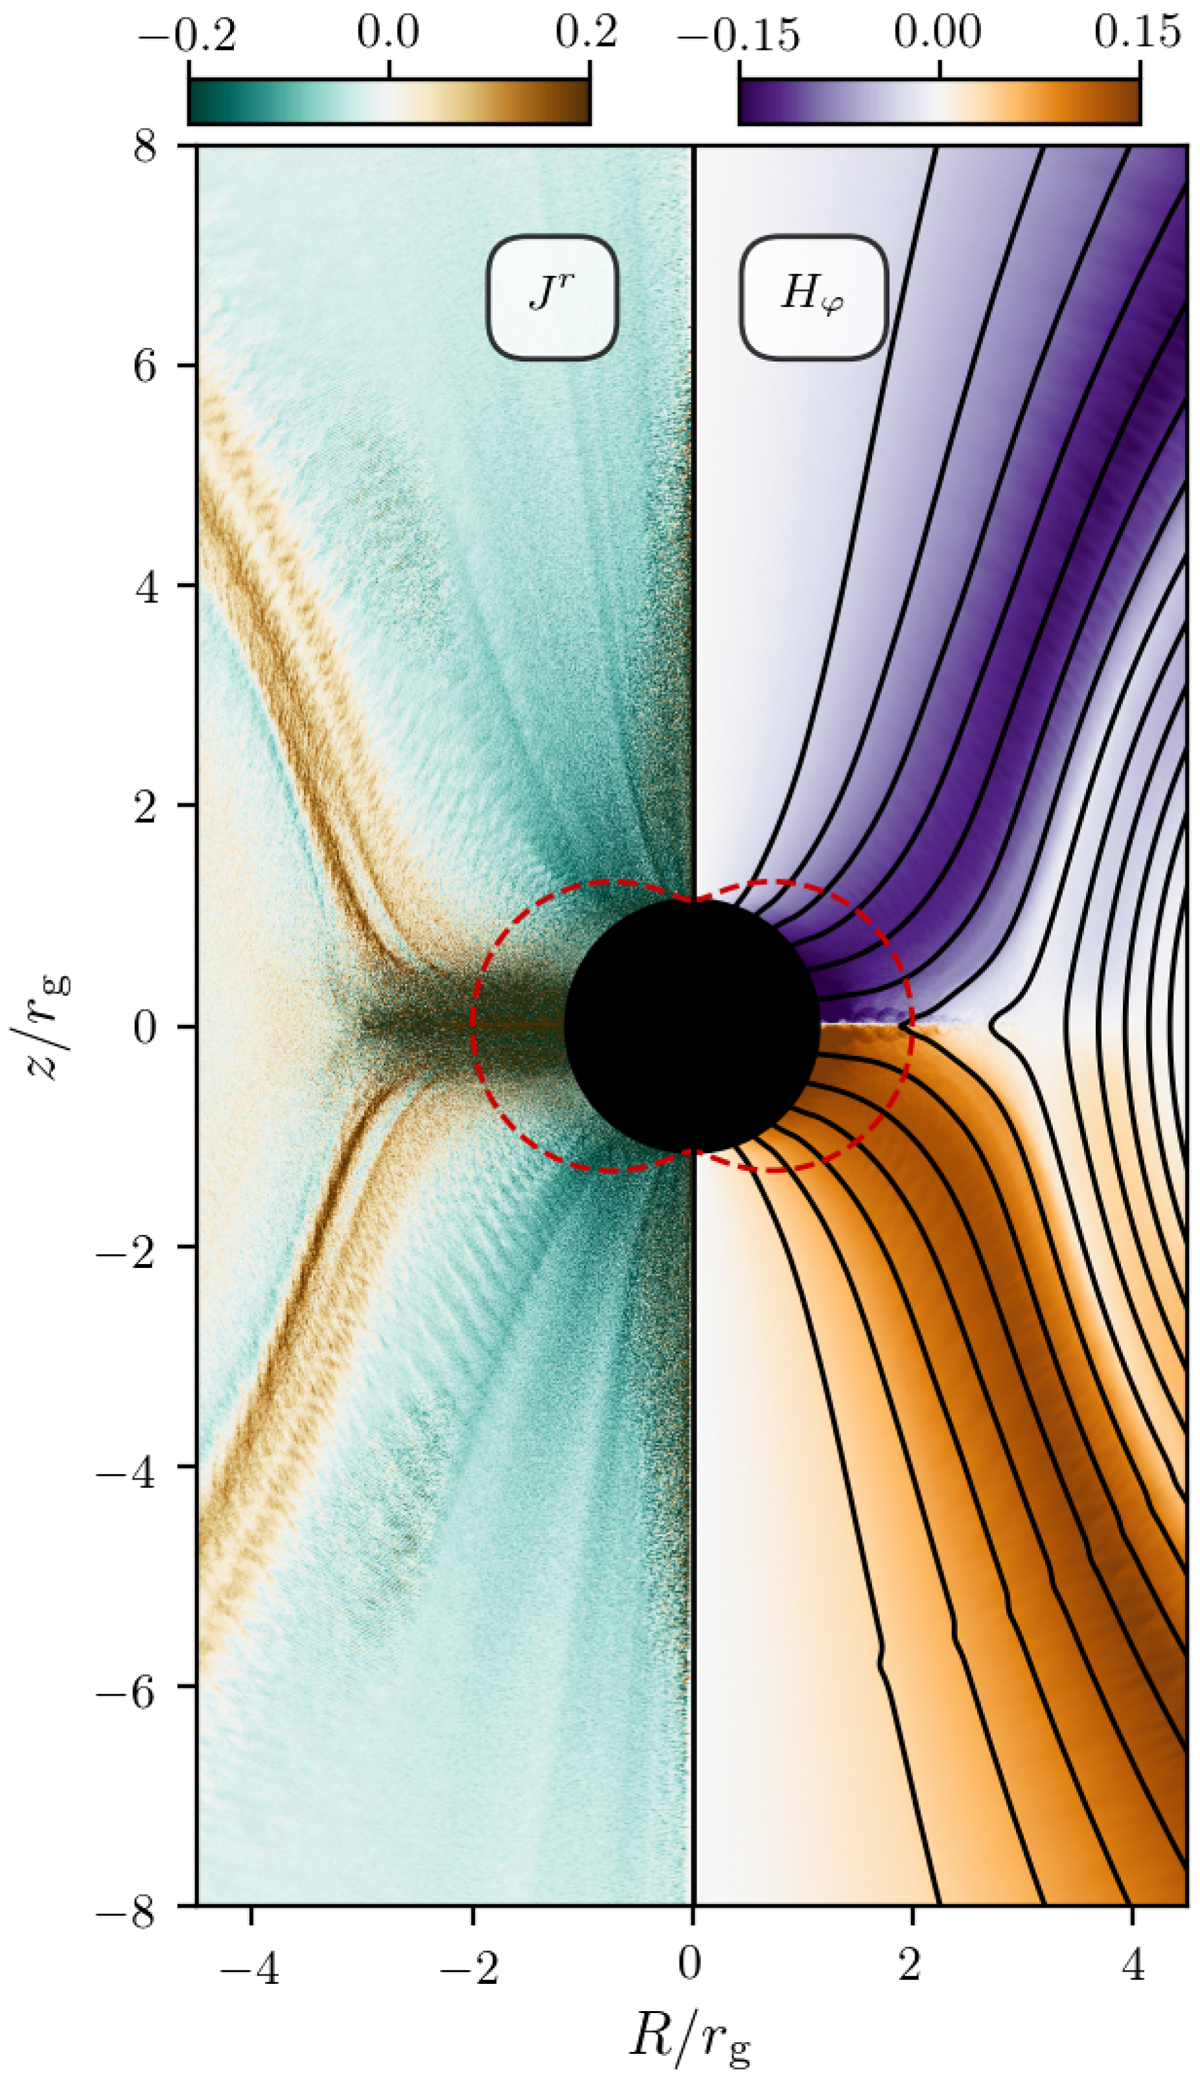
Maps of the steady-state quantities. Left panel: normalized electric current density Jr/ecnGJ. Right panel: normalized toroidal component Hφ/B0rg. Poloidal magnetic field lines are represented by black solid lines. The dashed red line indicates the surface of the ergosphere. The quantities are averaged between t = 100 rg/c and 110 rg/c.
Current usage metrics show cumulative count of Article Views (full-text article views including HTML views, PDF and ePub downloads, according to the available data) and Abstracts Views on Vision4Press platform.
Data correspond to usage on the plateform after 2015. The current usage metrics is available 48-96 hours after online publication and is updated daily on week days.
Initial download of the metrics may take a while.