Fig. 8.
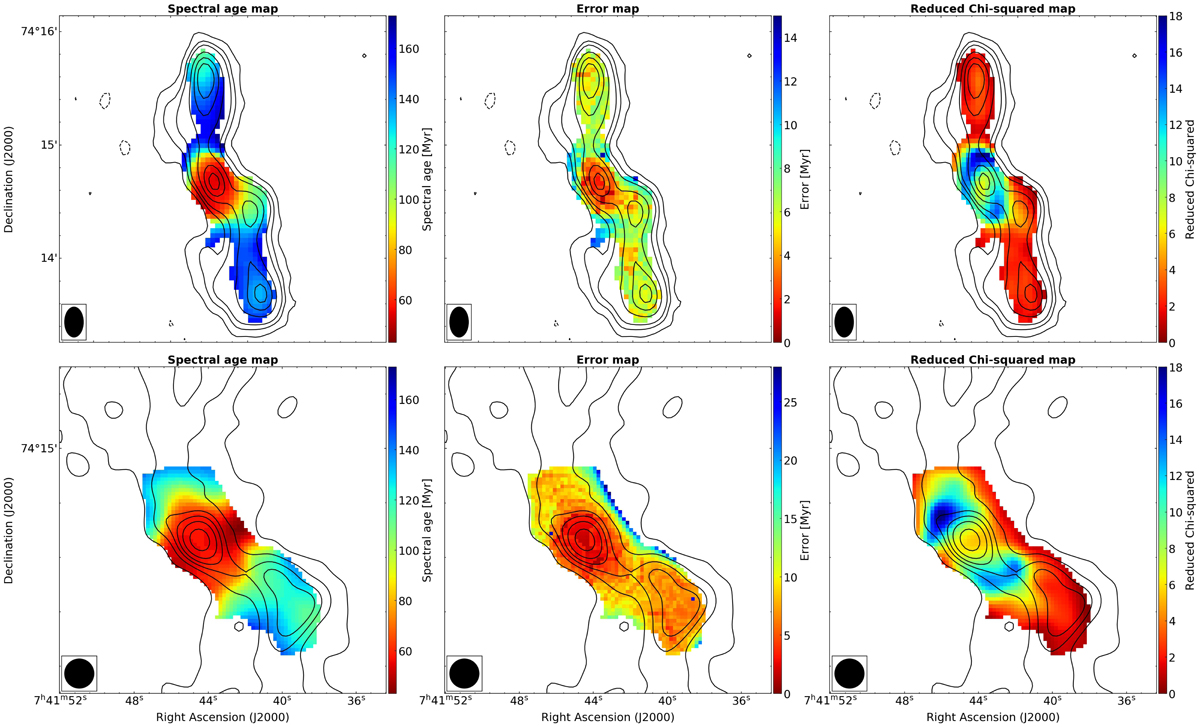
Tribble spectral ageing maps (left) and corresponding error maps (middle) and reduced chi-squared maps (right) of the entire source at a resolution of 16″ × 10″ (top panels) and of the central regions at a higher resolution of 6.5″ (bottom panels). The 325 MHz contours are overlaid. For the fit we set αinj = 0.75 and Beq = 5.9 μG.
Current usage metrics show cumulative count of Article Views (full-text article views including HTML views, PDF and ePub downloads, according to the available data) and Abstracts Views on Vision4Press platform.
Data correspond to usage on the plateform after 2015. The current usage metrics is available 48-96 hours after online publication and is updated daily on week days.
Initial download of the metrics may take a while.