Fig. 6.
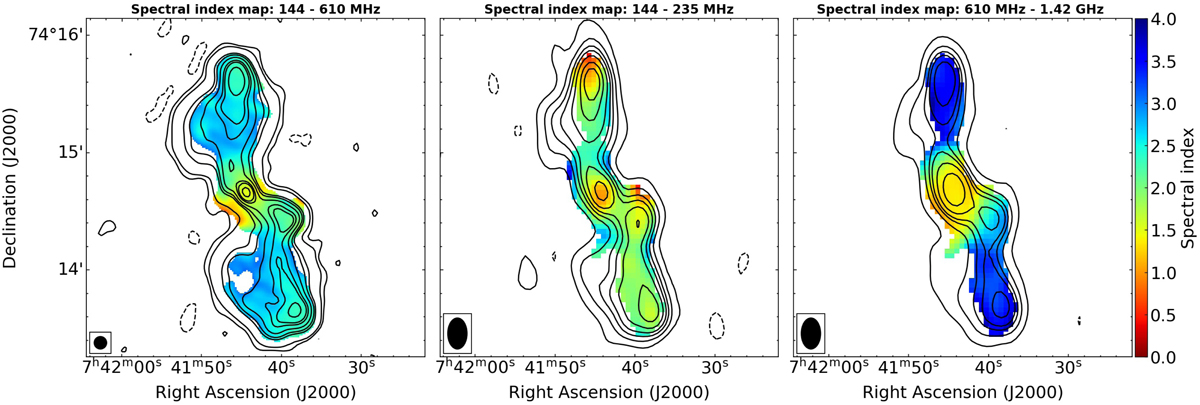
Spectral index maps of MS0735. Left: high-resolution spectral index map between 144 MHz and 610 MHz, resolution = 6.5″. The LOFAR contours are overlaid. Middle: low-frequency spectral index map between 144 MHz and 235 MHz, resolution = 16″ × 10″. The 235 MHz contours are overlaid. Right: high-frequency spectral index map between 610 MHz and 1420 MHz, resolution = 16″ × 10″. The 610 MHz contours are overlaid. The beam is shown in the bottom left corner of each map.
Current usage metrics show cumulative count of Article Views (full-text article views including HTML views, PDF and ePub downloads, according to the available data) and Abstracts Views on Vision4Press platform.
Data correspond to usage on the plateform after 2015. The current usage metrics is available 48-96 hours after online publication and is updated daily on week days.
Initial download of the metrics may take a while.