Fig. 4.
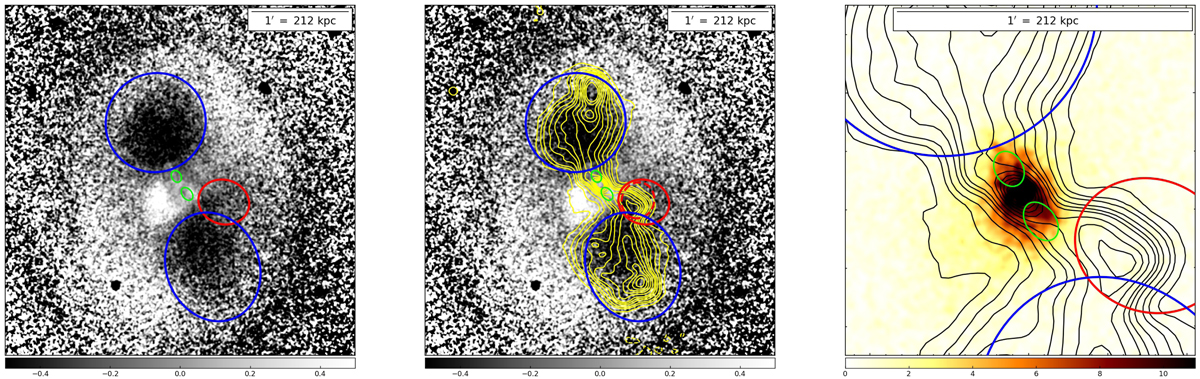
Chandra images of MS0735. Left: residual image after subtracting a double-β model from the X-ray image (0.5−7 keV). The image is in units of counts pixel−1 and is Gaussian-smoothed with a 1 arcsec kernel radius. The dark regions to the north and south correspond to two large cavities, marked by blue ellipses. A surface brightness edge surrounds these cavities and corresponds to a weak shock front. The red ellipse marks the newly discovered intermediate cavity south-west of the core, while green ellipses show the inner cavities. Middle: same as before, with the LOFAR contours at 144 MHz superposed, and the smaller region outlined by the dashed red ellipse is considered to place a lower limit on the size of the intermediate cavity. Right: soft-band (0.3−1.0 keV) image in units of counts pixel−1, Gaussian-smoothed with a 1 arcsec kernel radius. Two regions of low surface brightness, interpreted as a pair of cavities originating from a recent AGN outburst, are indicated with green ellipses. The LOFAR contours at 144 MHz and the blue and red ellipses showing the outer and intermediate cavities, respectively, are superposed.
Current usage metrics show cumulative count of Article Views (full-text article views including HTML views, PDF and ePub downloads, according to the available data) and Abstracts Views on Vision4Press platform.
Data correspond to usage on the plateform after 2015. The current usage metrics is available 48-96 hours after online publication and is updated daily on week days.
Initial download of the metrics may take a while.