Fig. 3.
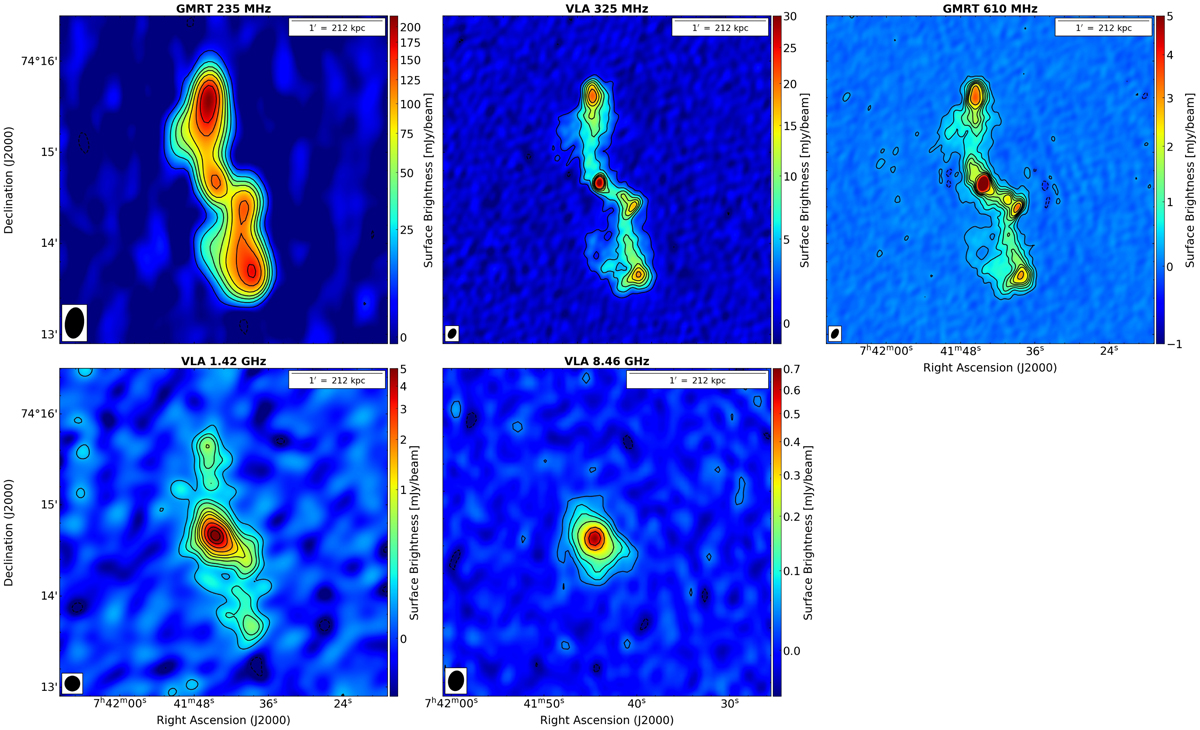
Radio maps of MS0735 at different frequencies. Top left: GMRT 235 MHz at 20″ × 12″ resolution. Levels: [−1, 1, 3, 5, 7, 10, 15, 20, 30] × 3σ (where σ = 2.7 mJy beam−1). Top middle: VLA 325 MHz image at 7″ × 5″ resolution. Levels: [−1, 1, 3, 5, 7, 9, 11, 15, 20] × 3σ (σ = 0.53 mJy beam−1). Top right: GMRT 610 MHz at 7″ × 4″ resolution. Levels: [−1, 1, 3, 5, 7, 9, 11, 15, 18, 30, 50] × 3σ (σ = 6.0 × 10⁻² mJy beam−1). Bottom left: VLA 1420 MHz at 10″ × 10″ resolution. Levels: [−1, 1, 2, 3, 5, 7, 9, 13, 20, 30, 40] × 3σ (σ = 4.2 × 10⁻² mJy beam−1). Bottom right: VLA 8460 MHz at 9″ × 7″ resolution. Levels: [−1, 1, 2, 3, 5, 10, 15] × 3σ (σ = 1.18 × 10⁻² mJy beam−1). The beam is shown in the bottom left corner of each image.
Current usage metrics show cumulative count of Article Views (full-text article views including HTML views, PDF and ePub downloads, according to the available data) and Abstracts Views on Vision4Press platform.
Data correspond to usage on the plateform after 2015. The current usage metrics is available 48-96 hours after online publication and is updated daily on week days.
Initial download of the metrics may take a while.