Free Access
Fig. 10.
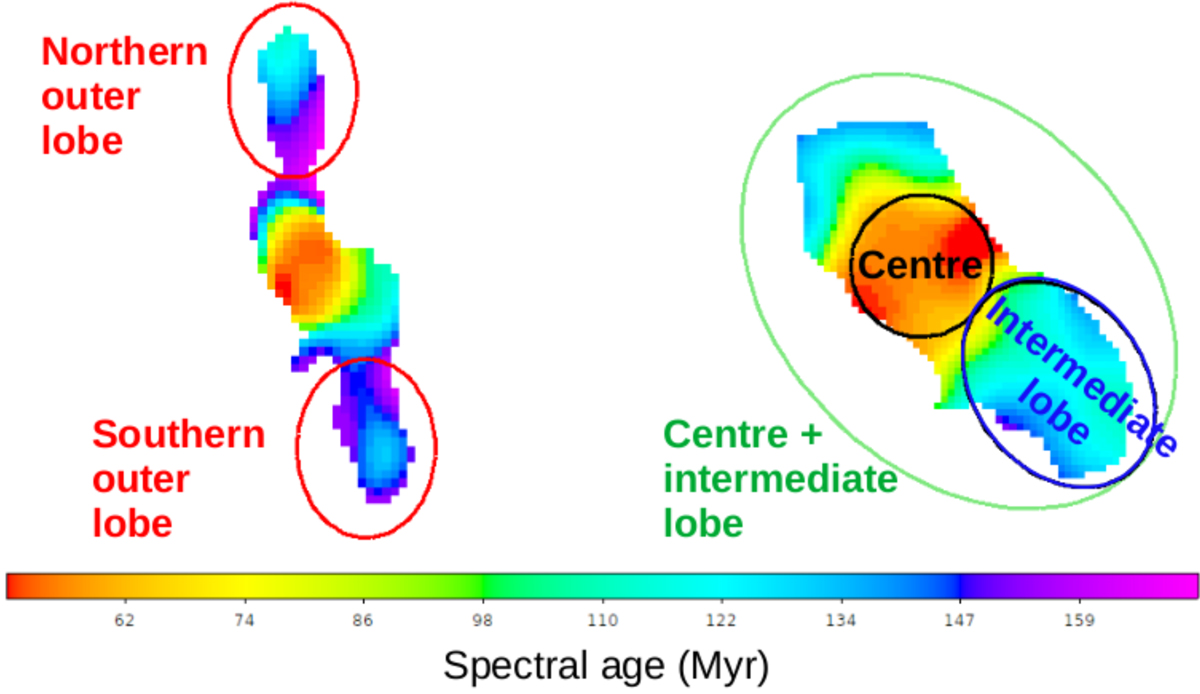
Representation of the regions used to measure the integrated flux density of the main features of the source, selected based on their age. The flux density of the outer lobes is measured from the low resolution images, while we used the higher resolution images to measure the flux of the centre and of the intermediate lobe.
Current usage metrics show cumulative count of Article Views (full-text article views including HTML views, PDF and ePub downloads, according to the available data) and Abstracts Views on Vision4Press platform.
Data correspond to usage on the plateform after 2015. The current usage metrics is available 48-96 hours after online publication and is updated daily on week days.
Initial download of the metrics may take a while.