Fig. 6.
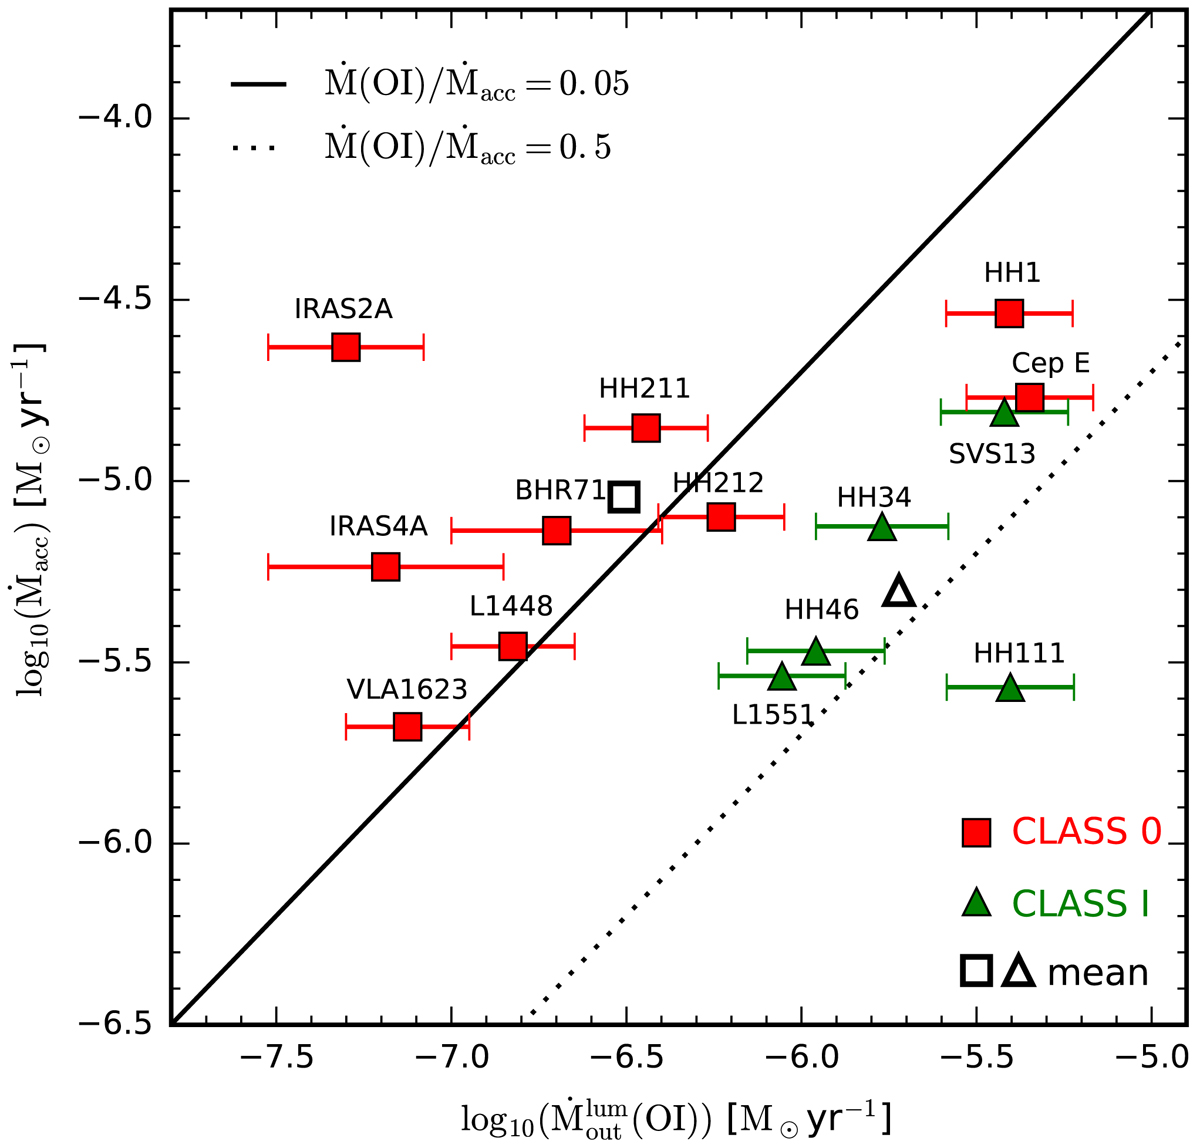
![]() (from Eq. (2)) versus Ṁacc diagram for the extensively mapped outflow sources. The adopted mass-loss rate for Cep E is the sum of both contributions from knot A and the jet; that is, (29.6−60.2)×10−7 M⊙ yr−1. In the case of HH 1, we considered the measurement at the HH 1 jet to be the best representation of the instantaneous mass-loss rate. Geometric means for Class 0/I outflows are plotted as non-filled black markers. Error bars in accretion rates are not depicted, but can be of the order of one magnitude.
(from Eq. (2)) versus Ṁacc diagram for the extensively mapped outflow sources. The adopted mass-loss rate for Cep E is the sum of both contributions from knot A and the jet; that is, (29.6−60.2)×10−7 M⊙ yr−1. In the case of HH 1, we considered the measurement at the HH 1 jet to be the best representation of the instantaneous mass-loss rate. Geometric means for Class 0/I outflows are plotted as non-filled black markers. Error bars in accretion rates are not depicted, but can be of the order of one magnitude.
Current usage metrics show cumulative count of Article Views (full-text article views including HTML views, PDF and ePub downloads, according to the available data) and Abstracts Views on Vision4Press platform.
Data correspond to usage on the plateform after 2015. The current usage metrics is available 48-96 hours after online publication and is updated daily on week days.
Initial download of the metrics may take a while.