Fig. 5.
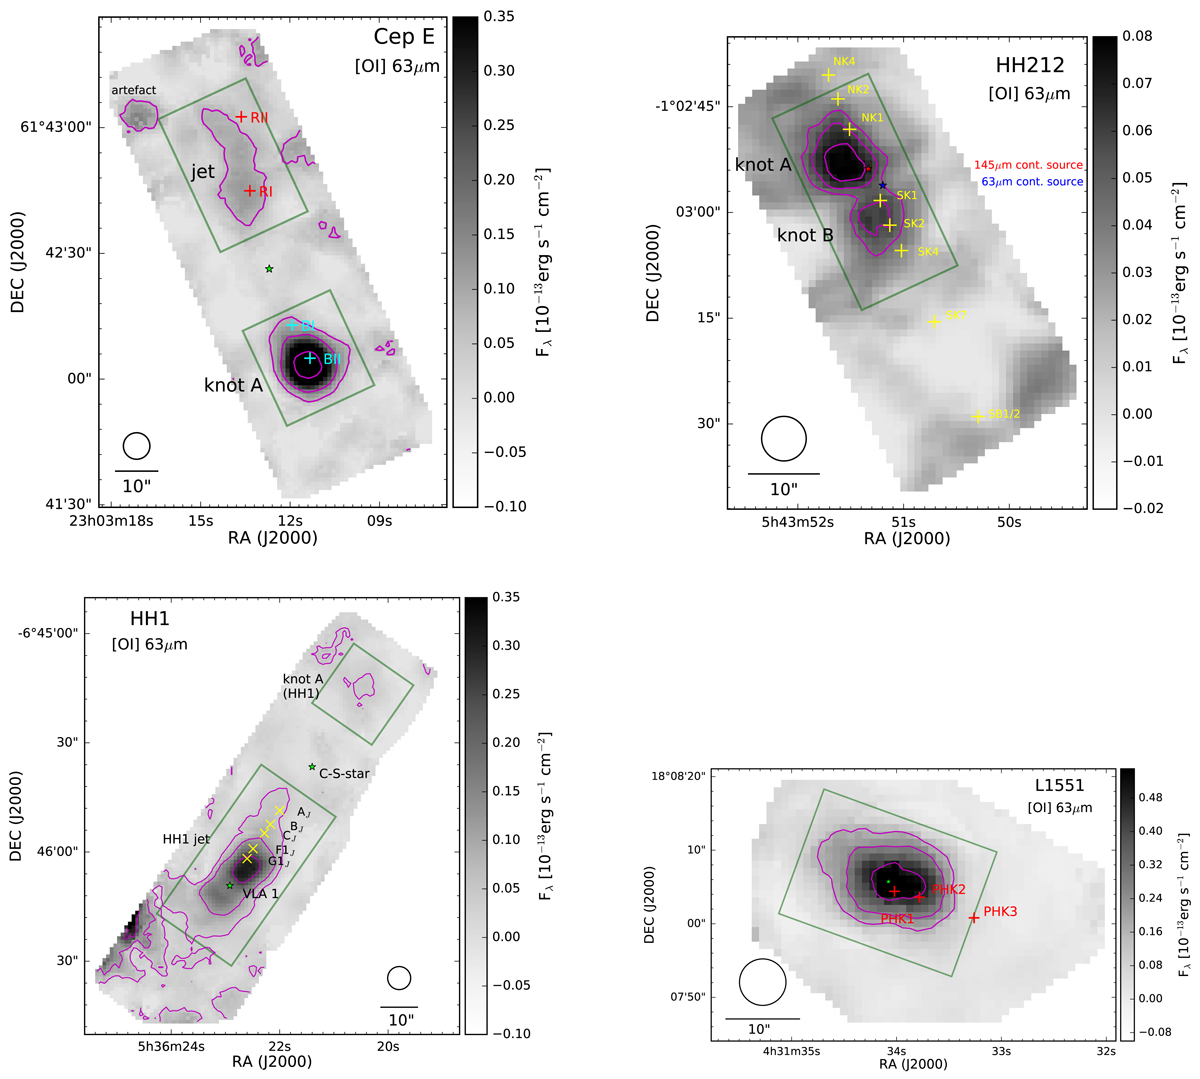
Continuum-subtracted [O I]63 maps of Cep E, HH 1, HH 212, and L1551 IRS5. The black circle shows the FWHM spatial beam size in the blue channel of the FIFI-LS instrument. The light green stars indicate the position of the respective jet-driving source. Schematic views are presented in Fig. D.1 of the Appendix. Contour lines are drawn in magenta in logarithmic scale at three intensity levels (IL). Cep E: RI, RII, BI, and BII are the infrared knots seen in the Spitzer/IRAC band-two (4.5 μm) image of Cep E (see Gusdorf et al. 2017). IL: (0.10, 0.21, 0.45)×10−13 erg s−1 cm−2. HH 1: yellow crosses indicate the positions of a few selected optical knots (Bally et al. 2002). IL: (0.06, 0.13, 0.28)×10−13 erg s−1 cm−2. HH 212: yellow crosses indicate the positions of the prominent H2 knots (Zinnecker et al. 1998). IL: (0.053, 0.062, 0.074)×10−13 erg s−1 cm−2. L1551: the brightest near-infrared [Fe II] knots (PHK1, PHK2, PHK3) are marked as red crosses (Pyo et al. 2002). IL: (0.20, 0.32, 0.50)×10−13 erg s−1 cm−2.
Current usage metrics show cumulative count of Article Views (full-text article views including HTML views, PDF and ePub downloads, according to the available data) and Abstracts Views on Vision4Press platform.
Data correspond to usage on the plateform after 2015. The current usage metrics is available 48-96 hours after online publication and is updated daily on week days.
Initial download of the metrics may take a while.