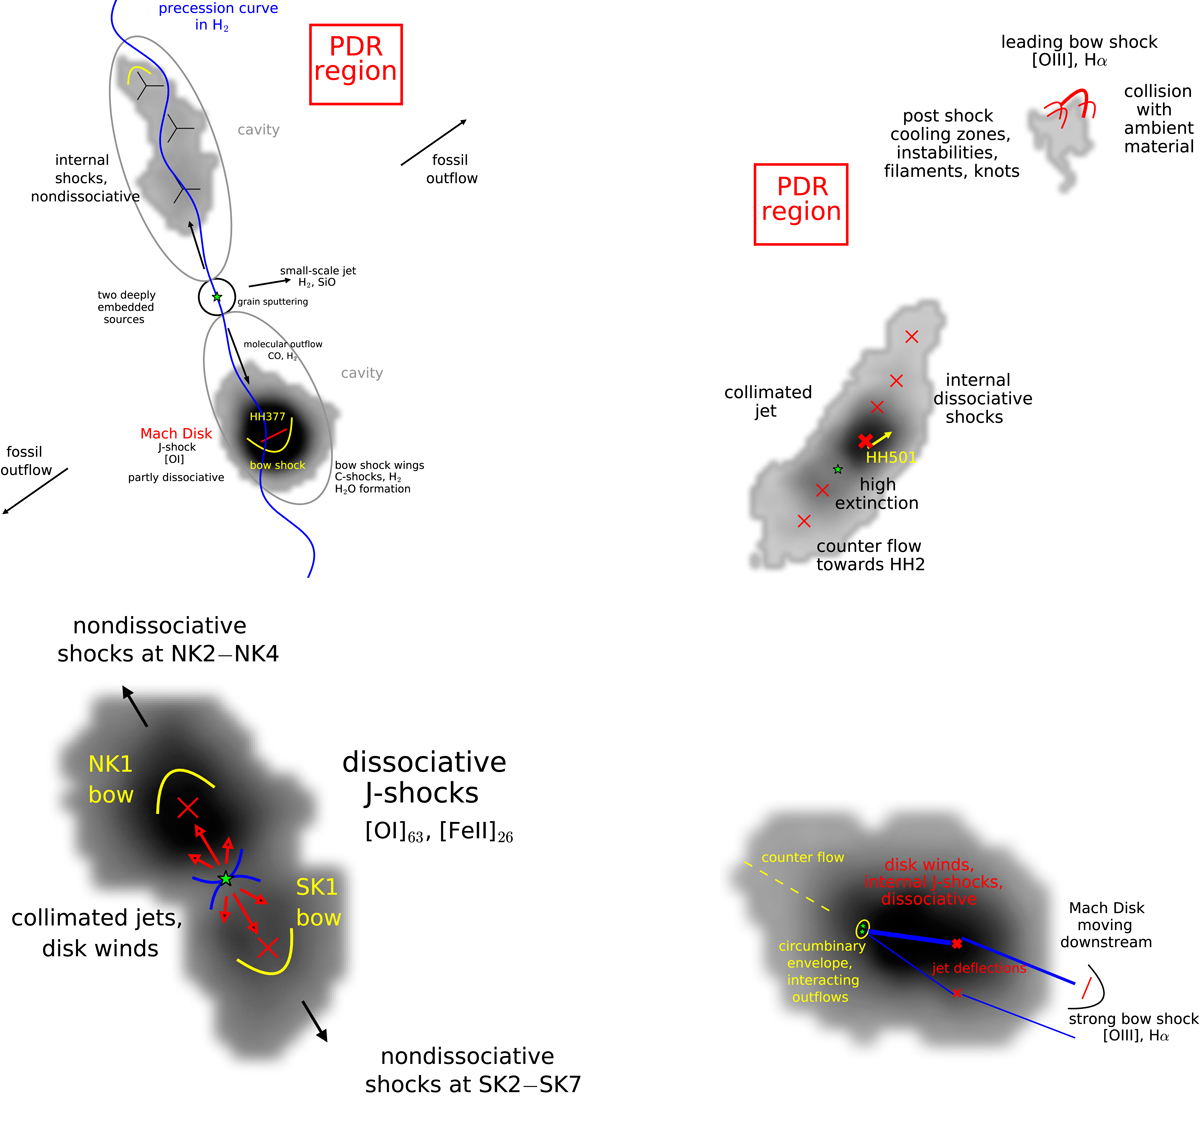
Fig. D.1.

Schematics of the Cep E (upper left), HH 1 (upper right), HH 212 (lower left), and L1551 IRS5 (lower right) outflow. The continuum-subtracted [O I]63 emission maps from the SOFIA/FIFI-LS observations are plotted in a grey colour scale. Source positions are marked as green stars. Our interpretations of the observed [O I]63 emission are based on previous studies briefly discussed in Appendix D.
Current usage metrics show cumulative count of Article Views (full-text article views including HTML views, PDF and ePub downloads, according to the available data) and Abstracts Views on Vision4Press platform.
Data correspond to usage on the plateform after 2015. The current usage metrics is available 48-96 hours after online publication and is updated daily on week days.
Initial download of the metrics may take a while.


