Free Access
Fig. B.1.
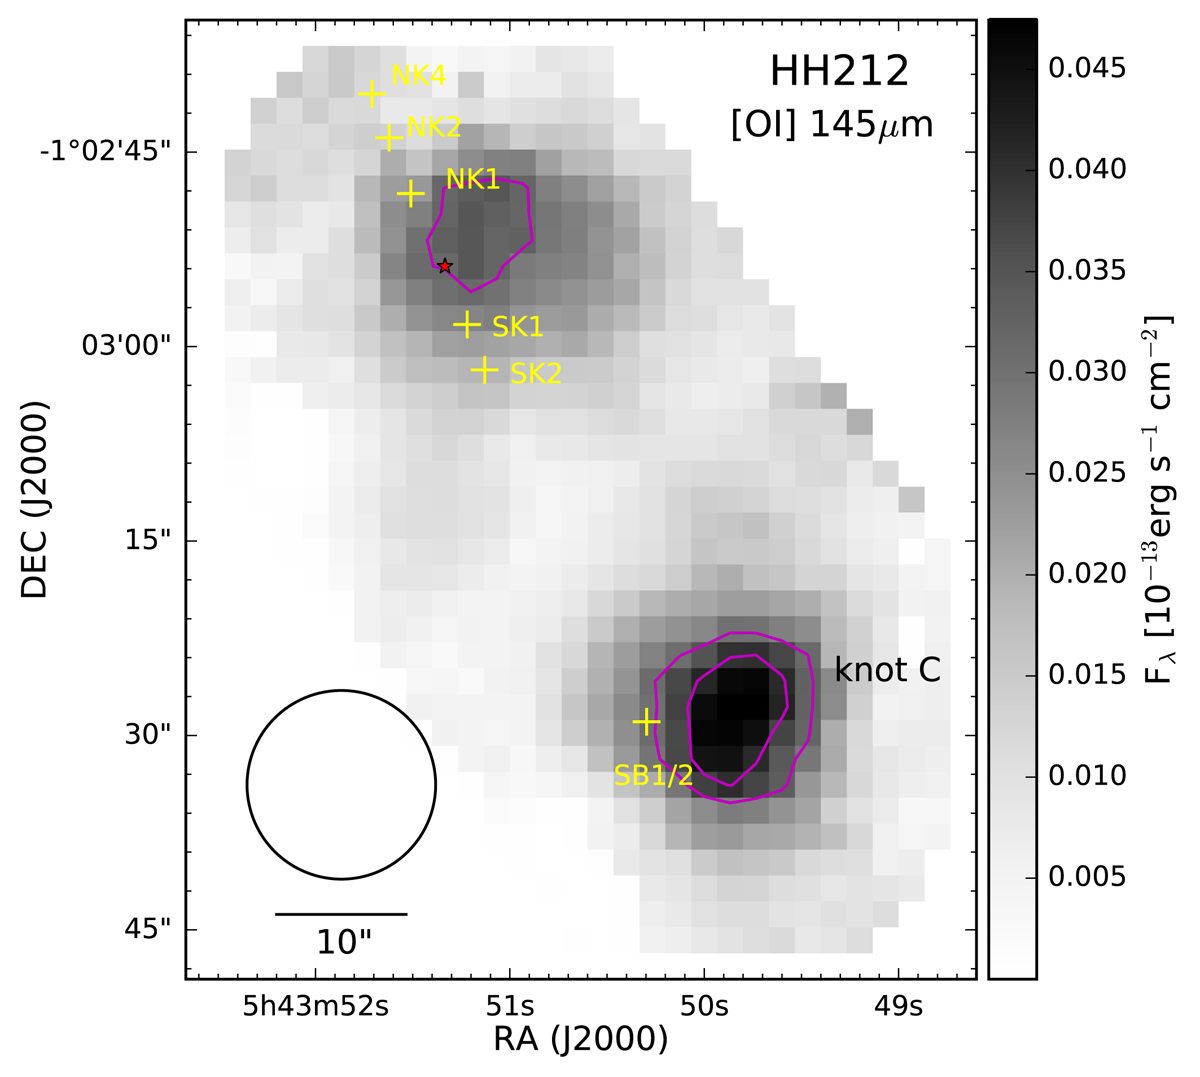
The continuum-subtracted [O I]145 emission map of HH 212. The bright emission knot C is not seen in the [O I]63 map, since it lies outside the mapped region (see Fig. B.2 for the [O I]145 line detection).
Current usage metrics show cumulative count of Article Views (full-text article views including HTML views, PDF and ePub downloads, according to the available data) and Abstracts Views on Vision4Press platform.
Data correspond to usage on the plateform after 2015. The current usage metrics is available 48-96 hours after online publication and is updated daily on week days.
Initial download of the metrics may take a while.