Fig. 1.
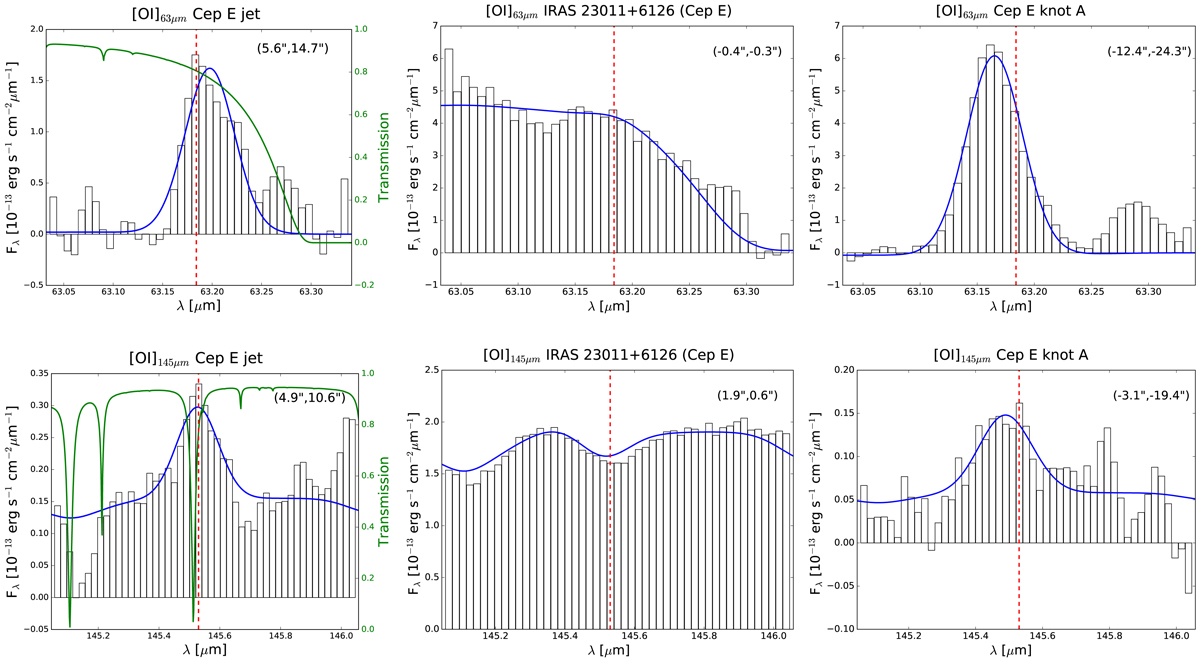
Sample spectra of the detected [O I]63, 145 lines at different regions of Cep E. Green lines display the atmospheric transmission τ in the spectral regions around both relevant far-infrared [O I] transitions. The fitted model function y (Eq. (1)) is plotted as a blue line in each spaxel. Vertical dashed red lines mark the position of the rest wavelengths of the [O I]63, 145 emission lines. Numbers in parentheses in the upper right corner indicate the individual spaxel position with respect to the driving source (see Fig. 5), that is the offset in right ascension and declination in units of arcseconds (ΔRA[″],ΔDec[″]).
Current usage metrics show cumulative count of Article Views (full-text article views including HTML views, PDF and ePub downloads, according to the available data) and Abstracts Views on Vision4Press platform.
Data correspond to usage on the plateform after 2015. The current usage metrics is available 48-96 hours after online publication and is updated daily on week days.
Initial download of the metrics may take a while.