Fig. A.2
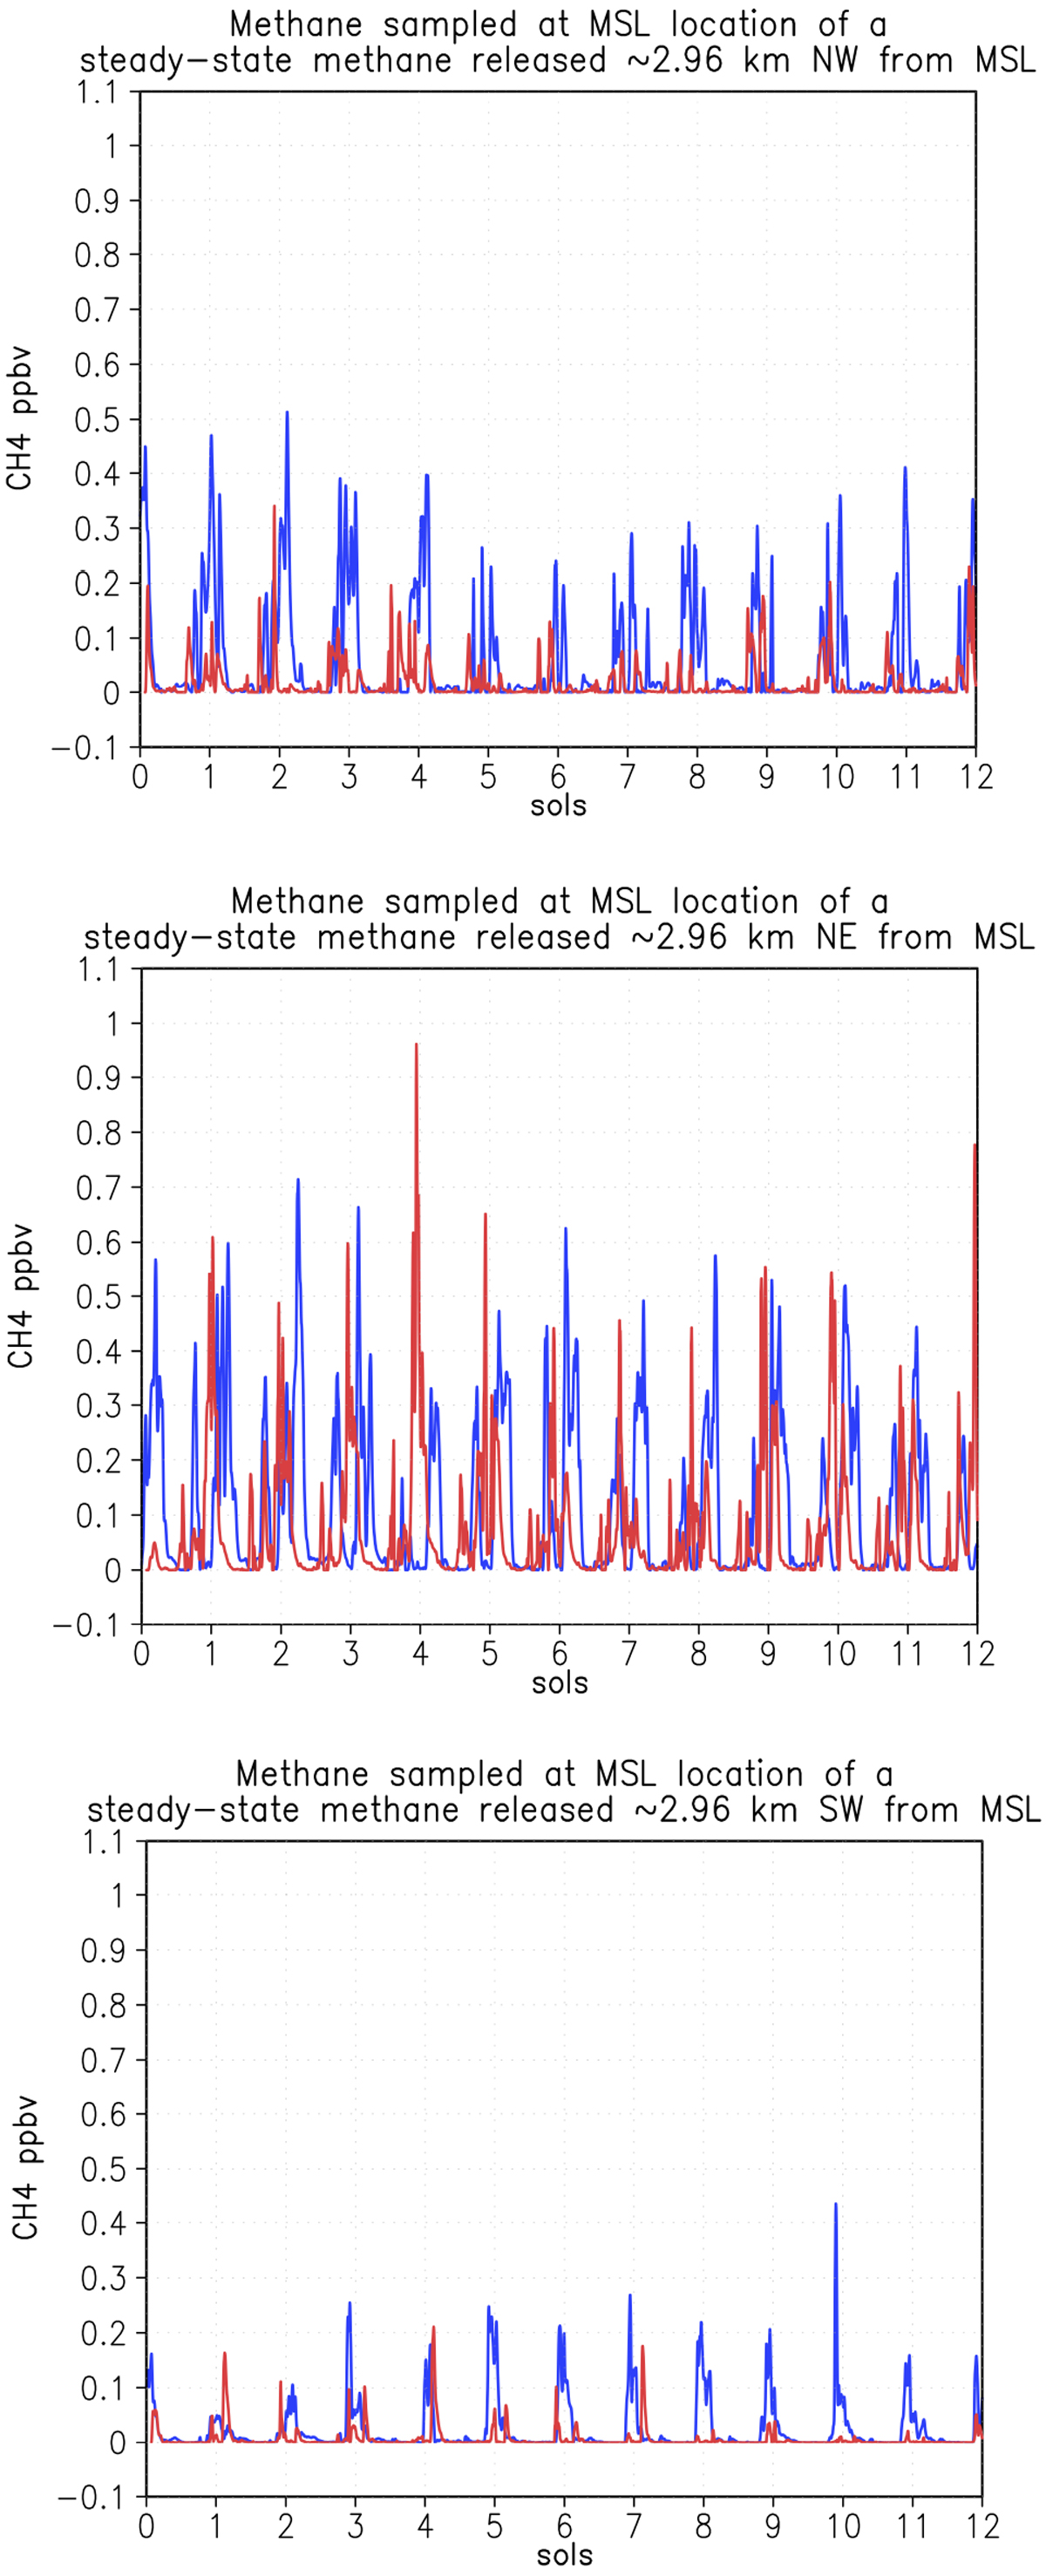
Twelve-sol time series of the MRAMS methane abundances sampled at the Curiosityrover location for sol 305 for three steady-state released inside Gale crater ~1 grid point (2.96 km) km NW, NE, and SW from rover location, each with an area of ~150 km2. Blue is LS 90°, and red is LS 270°. The abundance of tracers is shown shortly after the flux is turned on. Integer values of sols correspond to midnight, and intermediate values (0.5, 1.5, etc.) correspond to noon.
Current usage metrics show cumulative count of Article Views (full-text article views including HTML views, PDF and ePub downloads, according to the available data) and Abstracts Views on Vision4Press platform.
Data correspond to usage on the plateform after 2015. The current usage metrics is available 48-96 hours after online publication and is updated daily on week days.
Initial download of the metrics may take a while.