Fig. 3
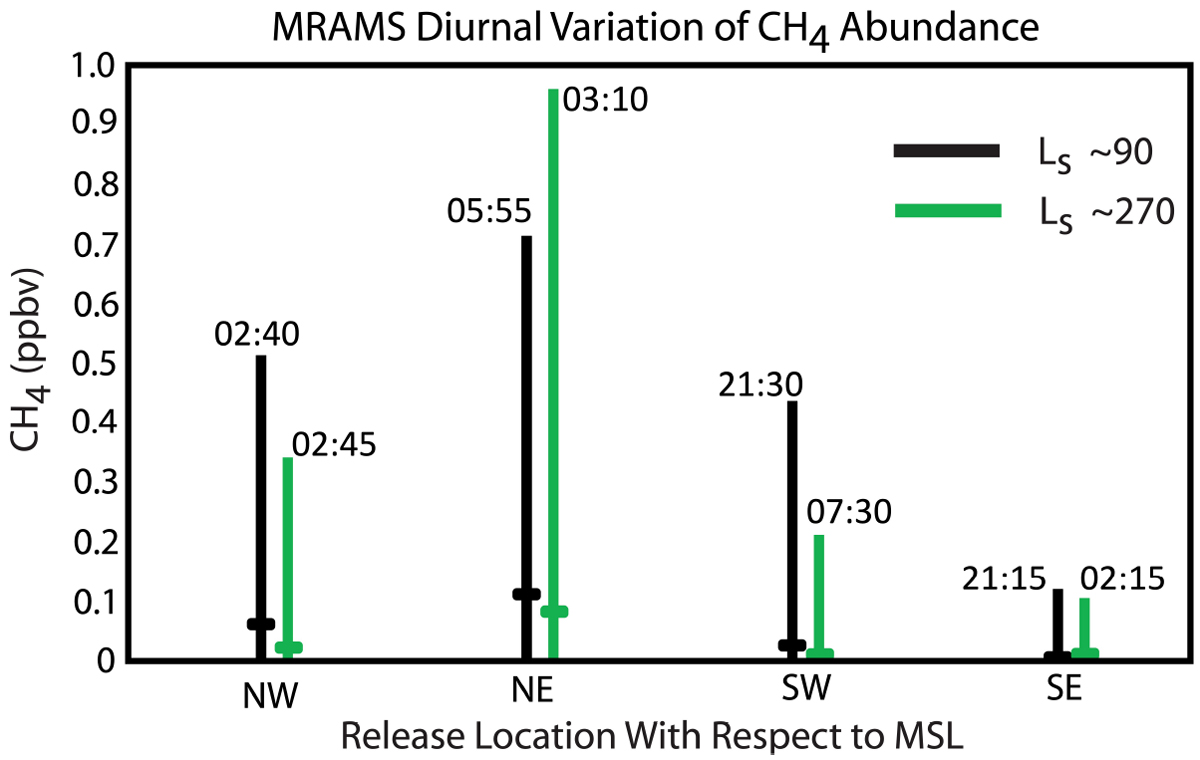
Diurnal variations of the methane mixing ratio for two seasons calculated from the Mars Regional Atmospheric Modeling System sampled at the Curiosity rover location for sol 305 assuming a constant methane surface flux of 1.8 × 10⁻⁶ kg m−2 s−1 emanating from locations ~1 grid point (2.96 km) to the NE, SE, SW, and NW of the rover. Vertical bars represent the amplitude of the diurnal cycle. The average local time of maximum abundance is indicated in the label at the top of the vertical bars. Thick horizontal lines indicate the diurnally averaged value.
Current usage metrics show cumulative count of Article Views (full-text article views including HTML views, PDF and ePub downloads, according to the available data) and Abstracts Views on Vision4Press platform.
Data correspond to usage on the plateform after 2015. The current usage metrics is available 48-96 hours after online publication and is updated daily on week days.
Initial download of the metrics may take a while.