Fig. 2
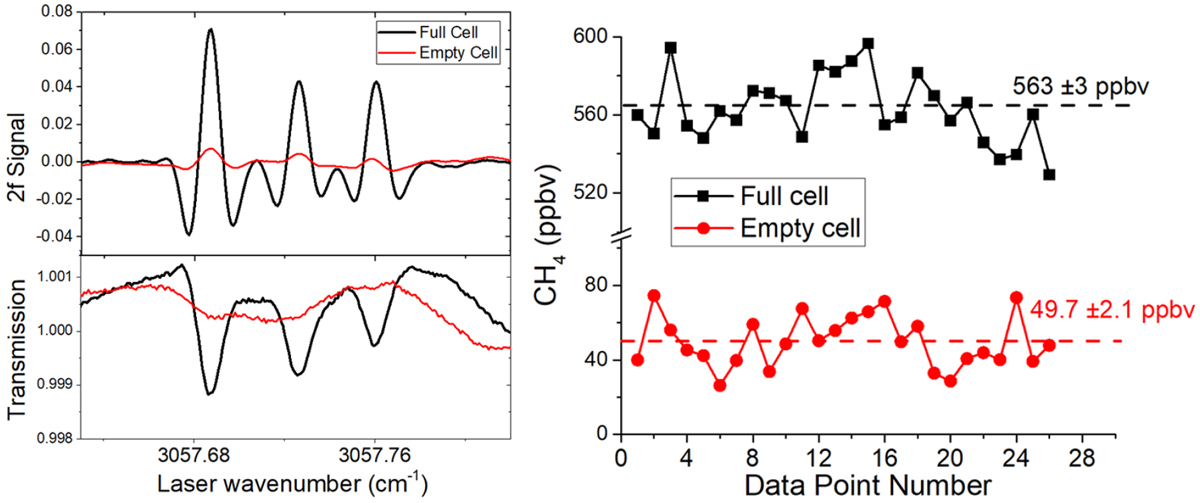
Spectra and data points for the June 19, 2020, spike in methane. Left: actual recorded average for the full cell following the two-hour ingest (black) and a sequential empty cell (red) for comparison. TLS records both direct and second harmonic spectra, the latter providing a better signal-to-noise ratio from a method of high-frequency laser modulation that discriminates against noise and broad interference fringes that are seen in the lower direct absorption spectrum. We note that the direct absorption spectrum analysis produced the same abundance value as the second harmonic result within the quoted errors. Right: plots of retrieved in situ CH4 abundances for each data collection point (26 each for full- and empty-cell runs) as measured in the Herriott cell using 2f spectra comparison with HITRAN 2016 (Gordon et al. 2017). Mean values and standard errors (±1sem) are shown. The reported 20.5 ppbv in situ spike results from taking the difference (full-empty), and dividing by the enrichment factor of 25. Detailed data tables are presented in the appendix.
Current usage metrics show cumulative count of Article Views (full-text article views including HTML views, PDF and ePub downloads, according to the available data) and Abstracts Views on Vision4Press platform.
Data correspond to usage on the plateform after 2015. The current usage metrics is available 48-96 hours after online publication and is updated daily on week days.
Initial download of the metrics may take a while.