Fig. 1
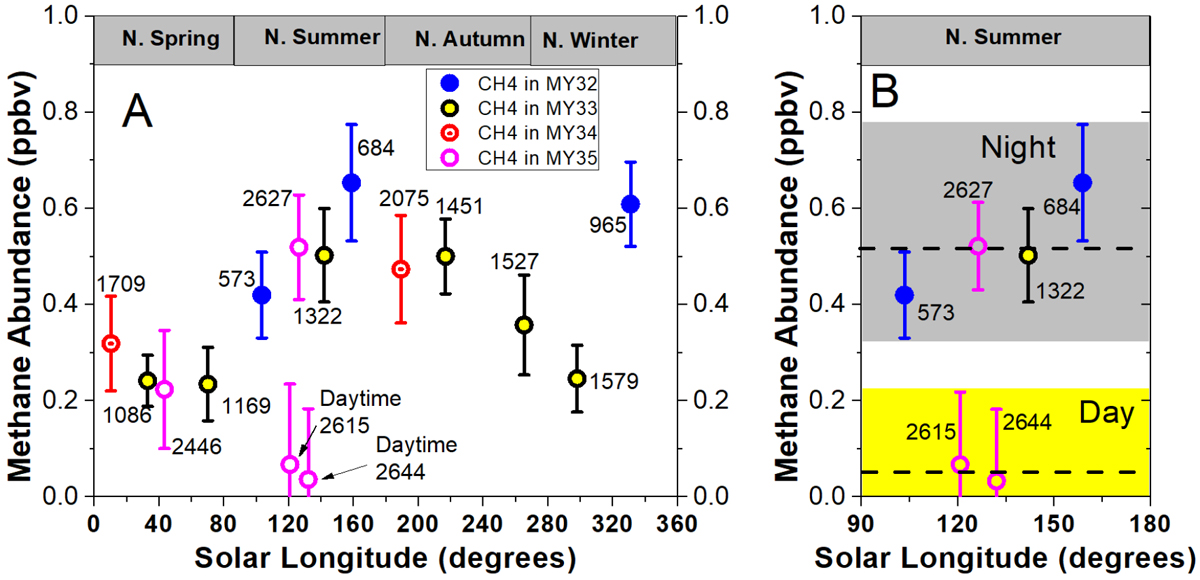
TLS-SAM enrichment measurements vs. Martian solar longitude. The plotted values have error bars of ±1 SEM, andare corrected to global mean annual values, with these and in situ measured values listed in Table 2. MY, Mars year. (A) All enrichment measurement up to January 12, 2020, excluding the 20 ppbv spike seen on June 20, 2019. This plot is an update of one published in Webster et al. (2018), but with five new data points added (whose individual data points are provided in the appendix). (B) Subset of the data plotted in (A), in the northern summer time frame, showing a mean value of 0.52 ± 0.10 ppbv (±2SEM) for the five nighttime measurements, and 0.05 ± 0.22 ppbv (±2SEM) for the two daytime measurements. Shaded regions include the full range of the error-bar extremes.
Current usage metrics show cumulative count of Article Views (full-text article views including HTML views, PDF and ePub downloads, according to the available data) and Abstracts Views on Vision4Press platform.
Data correspond to usage on the plateform after 2015. The current usage metrics is available 48-96 hours after online publication and is updated daily on week days.
Initial download of the metrics may take a while.